Advanced Service Catalog Reporting Techniques with Explore Analytics

The Service Catalog in ServiceNow allows you to manage and automate IT request fulfilment. While doing so, it collect valuable information about what requestors are asking for. These requests drive the work that your IT organization is performing, therefore advanced analysis of these requests can provide valuable insight as to the demand and how to address is proactively and efficiently.

Moreover, analyzing your service catalog data can answer questions such as are you getting the most out of your service catalog? Or are you leaving valuable insights on the table?

Understand Your Requestor’s Choices through Point-and-Click Variable Reporting

Requested Items in ServiceNow have important information on the parameters of what users want and why they want it – all stored in Catalog Variables. Those “variables” are not normal fields. While they provide great flexibility for detailing requests, they may be a challenge to standard reporting tools that don’t understand ServiceNow Catalog Variables.

Explore Analytics understands Catalog Variables. Using Explore Analytics you can use variables in reports much like you’d use normal fields. This enables point-and-click reporting to unleash the information in the variables and gain critical insights.

For example, this report shows a pivot grouped by variables named “Project Code” in requested items across the entire service catalog. This can provide key information on which projects are driving service requests:

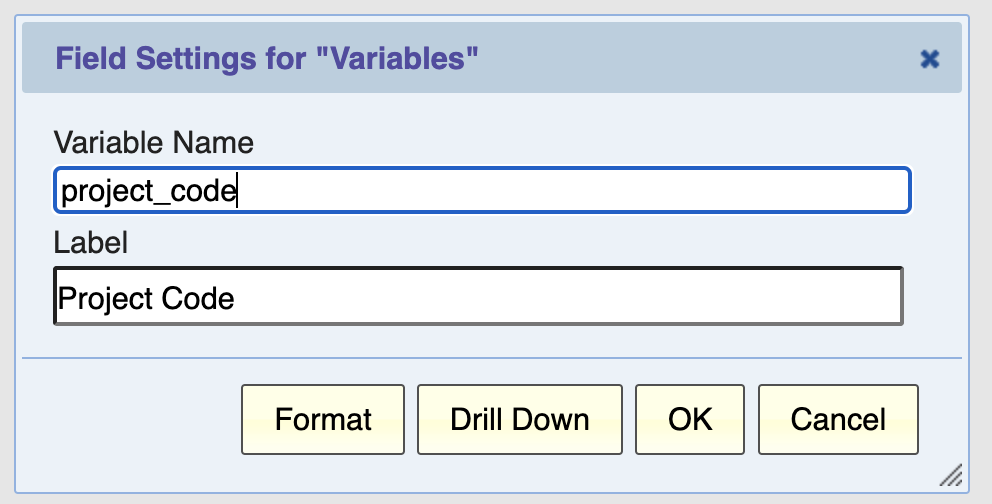
To select a variable, just type its name in the Variables field dialog:

Enrich Your Service Catalog Variable Reports with Data from Other Processes 

After unlocking the richness available within the Service Catalog, you can get further power by combining that data with data in other processes – for example, project or incident data.

For instance, the previous Project Code example stored only a text string of information from the project. By using the Explore Analytics “lookup()” function, you can enrich the catalog data with information from project management. Here, the “Project Code” variable is being used to pull the “Portfolio” field from the project table:

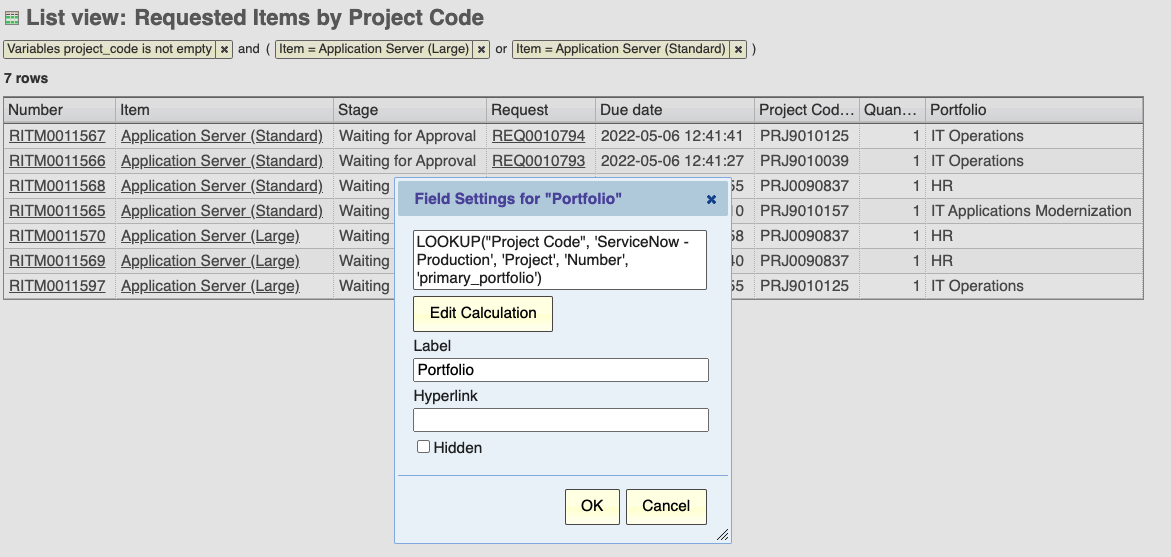
Consider how data from other processes can enrich your service catalog data. Any information stored within a variable can unlock even more data from throughout your ServiceNow environment!

Compare Service Catalog Requests with Other Processes

In addition, you can leverage that data outside the Request process to look holistically across multiple processes.

The next dashboard uses the term “End User Demand” to group together incidents and catalog requests.

The first tab looks at trends – how many requests and incidents are cumulatively being opened. This can be critical as you look to staff and understand what demands are being placed on your organization.

The second tab looks into what is actually being requested and how. The first report looks at what categories of incidents or requests are being opened (combining together the “category” field on Incident with the “item.category” field on requested item). The second report analyzes how requests and incidents are being opened by requestors. Try using the drop-down to focus on incidents or requested items!

Don’t Let Valuable Information Go to Waste – Get Deeper Insights on your Catalog!

As these examples illustrate, your Service Catalog has deep insights on how your requests are being opened and why.

If you’ve invested in driving requests through the Service Catalog, you’re ready to take the next step: unleashing insights on your user need and shifting to a proactive service delivery model!

Why Mature IT Security Requires Analytics

Why Mature IT Security Requires Analytics

Pressure is mounting on IT organizations to swiftly adapt to rapidly evolving security threats. You need to use every tool in your toolbox—especially analytics—to rise to these new challenges.

Too often, we think about analytics in the background. Yet, powerful, responsive analytics are as important as vulnerability scanners, automated testing, or workflow management tools.

Not only can trends and ad-hoc reports answer questions and provide information, but real-time operational dashboards can drive behavior to support secure processes.

Use Real-Time Dashboards to Drive Rapid Response to Security Incidents

The first step to rapid response is the ability for users to quickly prioritize and respond to issues as they arise.

The following example is a quick report built with only a few clicks can show team members their work based on how long they’ve been open. This team leader’s report highlights security incidents that have been lingering for more than one day:

Logged-in users can drill through that report and act immediately. One global IT organization deployed aging reports and had a 30% reduction in stale incidents.

Here, analytics isn’t just a passive process of tracking success, it’s driving improved success.

Analyze Data On-The-Fly to Identify Security Threats

The ability to quickly build ad-hoc reports on-the-fly with a wealth of data is key to investigating issues. You need to have the capability to spot a problem, ask questions, get results, and propose solutions within just a few clicks.

This next report harnesses the power of the CMDB to walk the relationships between CI’s and identify which business services are experiencing the most security incidents:

Looking at that report, it’s easily apparent that two of the most targeted services are both experiencing a lot of incidents related to their web servers.

Another example combines data from two different tables – Security Incident and Assets – to identify which models of assets are experiencing the most security incidents:

Now you are getting past the question of how many security incidents and into the answer of why. Are there specific models experiencing disproportionate issues? Could we improve security by phasing those models out?

Also, are you surprised to see in that example that “Unknown” asset model has the most security incidents? Probably not – that brings us to the last area where analytics drives improved security:

Leverage Analytics to Empower Users to Maintain Critical Reference Data

Data quality analytics bring together driving user behavior and investigating problems.

Data quality is the bedrock of processes because you can’t secure what you can’t see.

By creating a dashboard that shows data owners the quality of the data they’re responsible for, you can both drive improve compliance and resolve underlying issues proactively.

In the following dashboard, part of our pre-built CMDB Quality Application, has two components: KPIs showing the overall success of the data quality process, and a dashboard for owners of business services to see what data issues their services have:

Again, the dashboard transforms behavior, rather than assigning audit tasks on an annual basis that creates a lot of work all at once.

Analytics: The Bedrock of Ongoing Activity to Support Security

Are you using analytics as part of your security toolkit?

Analytics is a road to getting the entire organization working towards the same objectives, shaping their day-to-day activity towards quickly and thoroughly resolving issues with the information they need at their fingertips.