So you’ve reached the limits of ServiceNow reporting, and you’re interested in taking the next step. Your managers want visibility on their teams’ work, your executives want a deeper understanding of the performance of IT, and your process owners desire a higher level of maturity.
To help you find the best ServiceNow reporting and analytics solution, we’ve pulled together the top five questions to ask of any solution you’re considering.
- Is self-service reporting provided?
- Are reports actionable in real time?
- Can reports be accessed in ServiceNow and elsewhere?
- Can reports answer complex questions?
- How soon can reports be deployed?
Let’s review each question.
1) Is Self-Service Reporting Provided?
Users expect to own their work and to be able to quickly answer questions. Allowing users self-service to answer their own question is an important attribute of a reporting solution.
Analytics tools are often designed for highly skilled “report administrators” who create reports and dashboards for others. This frequently leads to a resource bottleneck, where users reporting needs must be prioritized and delayed.
Another option is to buy an ITSM dashboard in hope that it has the answers to everyone’s questions. Alas, such a solution prevents any ad hoc reporting capabilities, and expects your user’s needs to fit into a one-size-fits-all approach with limited ability to explore data.
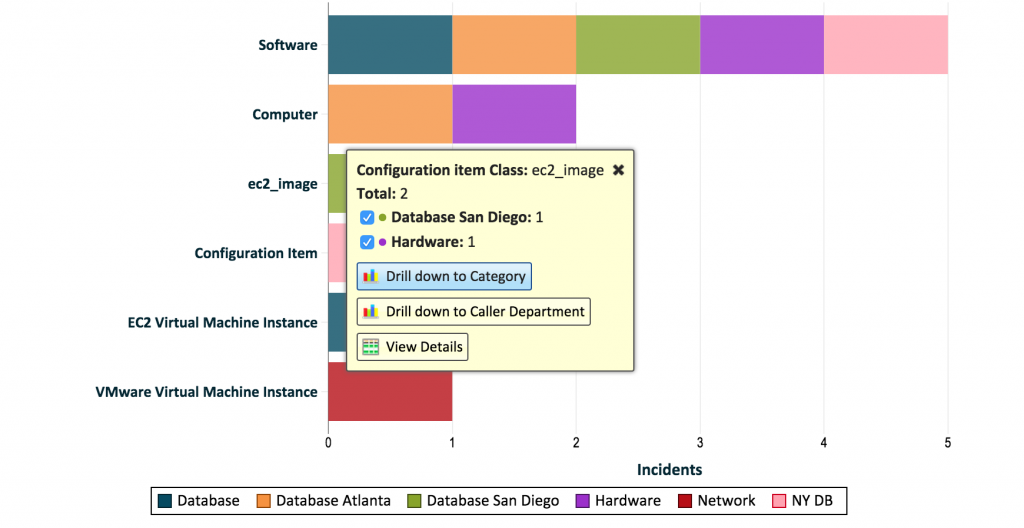
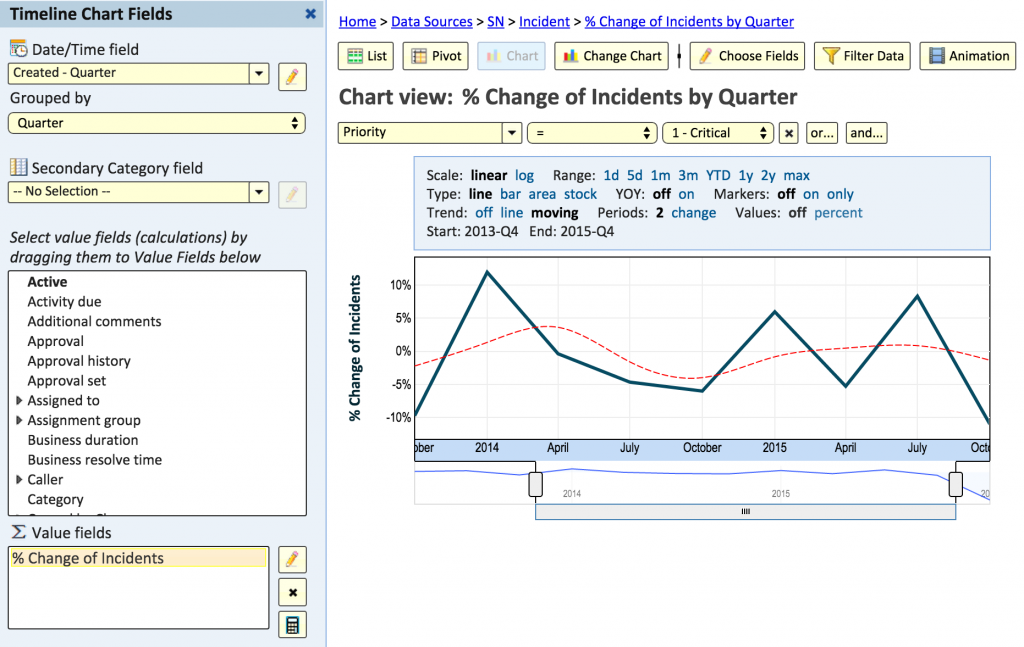
Explore Analytics empowers any user with self service. Using intuitive drag-and-drop controls, Explore Analytics is designed to put power in the hands of users, allow them to explore the data and gain insights. Power users can create sophisticated reports, trends, and scorecards and share those with other users so you get the best of both worlds.
2) Are Reports Actionable in Real Time?
Users must be empowered to take immediate action on information. One important aspect of this is the ability to see up to the minute information.
Some solutions will propose daily, weekly, or monthly views of the data. While historical reporting is useful for long-term strategy, it must be paired with live, actionable reporting.
Another important aspect is the ability to drill through to the details behind reports. Often, this is another place where users are asked to compromise when you go beyond the out-of-the-box reporting in ServiceNow.
Explore Analytics is the only solution for ServiceNow that provides live, drillable advanced analytics. Even complex reports that calculate data across multiple tables provide real-time drillable information.
3) Can Reports be accessed in ServiceNow and Elsewhere?
ServiceNow users expect to see reports in the ServiceNow user interface while non-IT users may prefer to get these reports by email or see them in a portal such as SharePoint.
Many third-party solutions are delivered outside of the ServiceNow user interface.
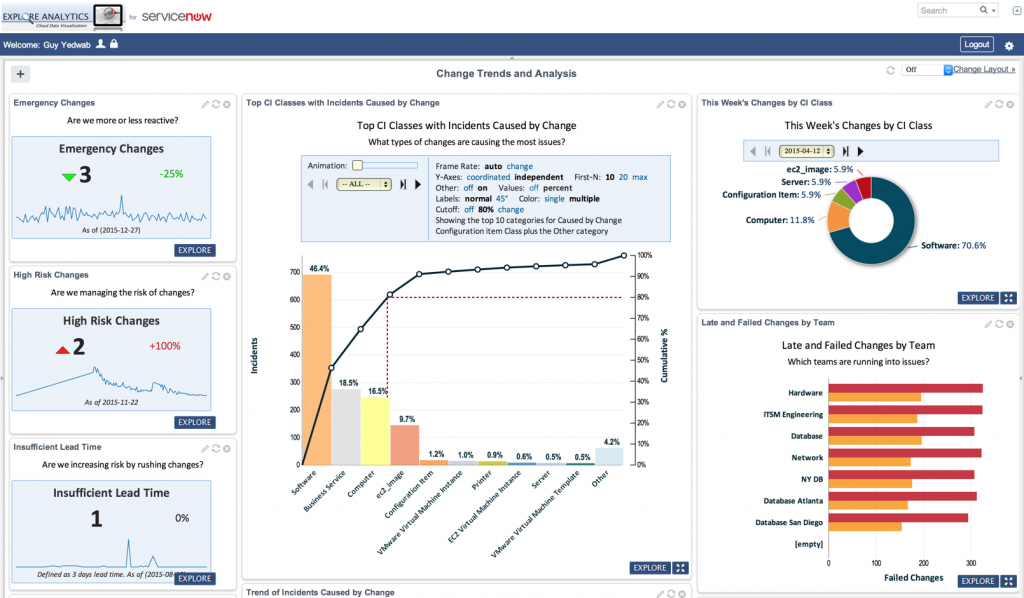
Explore Analytics integrates seamlessly into the native ServiceNow dashboards, with no additional passwords or set-up to view them. For non-ServiceNow users, fully interactive Explore Analytics reports can be emailed or embedded in any Web page or portal such as SharePoint.
These reports are fully interactive, allowing users to drill-down, drill through to details, reformat and adjust the reports as desired, and do that right in the dashboard.
4) Can Reports Answer Complex Questions?
When considering a reporting solution, consider whether the following is possible to do:
- Allow any user to create live, ad hoc multi-level pivot reports?
- Allow any user to combine data from multiple tables (or indeed multiple data sources) without needing to understand complex database concepts?
- Allow any user to perform calculations against the data without requiring code?
- Allow any user to drill down any number of levels in the reporting view?

With Explore Analytics, the answers to the above questions are all yes.
5) How Soon Can Reports Be Deployed?
Reporting solutions that periodically copy ServiceNow data into a warehouse require considerable up-front work by specialized people and on-going maintenance. Security access control rules have to be reproduced in the warehouse. This setup must happen before reports can be deployed.
With Explore Analytics, the technical deployment can be done within minutes because it understands ServiceNow natively. Security rules in ServiceNow are respected and users only see the portions of the data that they are allowed to see. All that’s needed to get started with Explore Analytics is to apply an update set, create a service account, and the integration will set itself up.
Explore Analytics is easy to use. Users get up to speed swiftly with quick enablement videos.
Even better, you can leverage the predefined Analytical Application for ITSM to get immediate insight and value. The app is complete with pre-built dashboards and reports that leverage best practices. The app is built using the same intuitive self-service interface, and is easily adjusted to fit your unique environment.
Conclusion
Explore Analytics is designed for ServiceNow. It provides self-service ad-hoc data reporting, advanced reporting and analytics, trending and scorecards, and provides it all without forcing tradeoffs and compromises.
To see for yourself how Explore Analytics will fit your needs, you can see the live demo environment, or sign up for a free evaluation to try it against your own data and get going in minutes!

