The Service Catalog in ServiceNow allows you to manage and automate IT request fulfilment. While doing so, it collect valuable information about what requestors are asking for. These requests drive the work that your IT organization is performing, therefore advanced analysis of these requests can provide valuable insight as to the demand and how to address is proactively and efficiently.
Moreover, analyzing your service catalog data can answer questions such as are you getting the most out of your service catalog? Or are you leaving valuable insights on the table?
Understand Your Requestor’s Choices through Point-and-Click Variable Reporting
Requested Items in ServiceNow have important information on the parameters of what users want and why they want it – all stored in Catalog Variables. Those “variables” are not normal fields. While they provide great flexibility for detailing requests, they may be a challenge to standard reporting tools that don’t understand ServiceNow Catalog Variables.
Explore Analytics understands Catalog Variables. Using Explore Analytics you can use variables in reports much like you’d use normal fields. This enables point-and-click reporting to unleash the information in the variables and gain critical insights.
For example, this report shows a pivot grouped by variables named “Project Code” in requested items across the entire service catalog. This can provide key information on which projects are driving service requests:
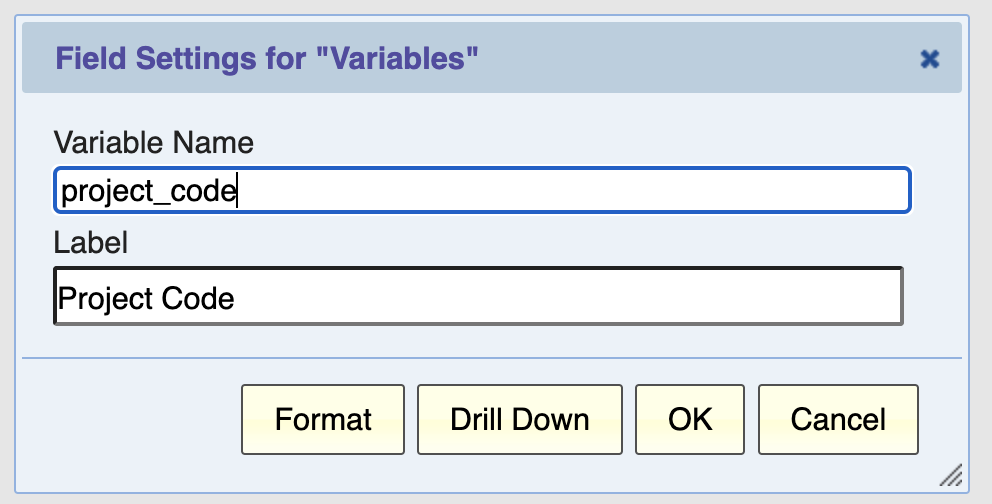
To select a variable, just type its name in the Variables field dialog:
Enrich Your Service Catalog Variable Reports with Data from Other Processes
After unlocking the richness available within the Service Catalog, you can get further power by combining that data with data in other processes – for example, project or incident data.
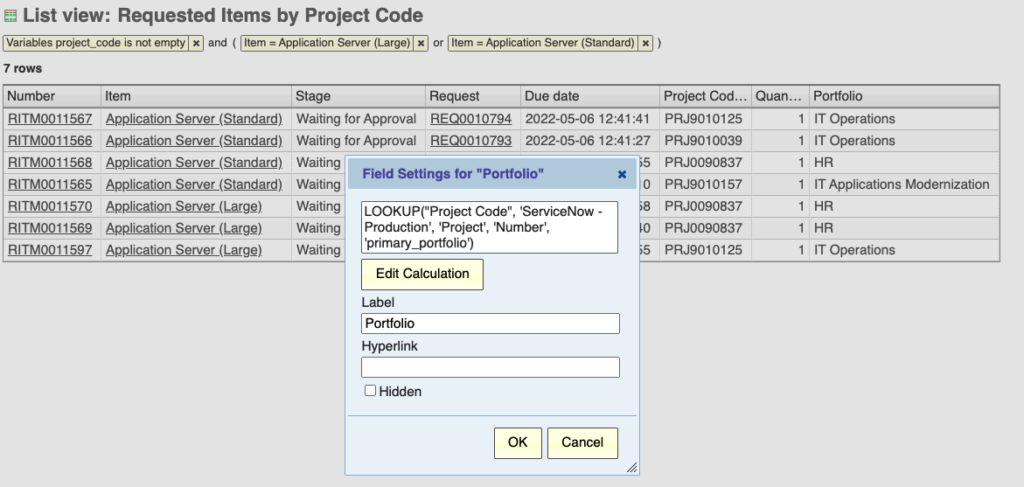
For instance, the previous Project Code example stored only a text string of information from the project. By using the Explore Analytics “lookup()” function, you can enrich the catalog data with information from project management. Here, the “Project Code” variable is being used to pull the “Portfolio” field from the project table:
Consider how data from other processes can enrich your service catalog data. Any information stored within a variable can unlock even more data from throughout your ServiceNow environment!
Compare Service Catalog Requests with Other Processes
In addition, you can leverage that data outside the Request process to look holistically across multiple processes.
The next dashboard uses the term “End User Demand” to group together incidents and catalog requests.
The first tab looks at trends – how many requests and incidents are cumulatively being opened. This can be critical as you look to staff and understand what demands are being placed on your organization.
The second tab looks into what is actually being requested and how. The first report looks at what categories of incidents or requests are being opened (combining together the “category” field on Incident with the “item.category” field on requested item). The second report analyzes how requests and incidents are being opened by requestors. Try using the drop-down to focus on incidents or requested items!
Don’t Let Valuable Information Go to Waste – Get Deeper Insights on your Catalog!
As these examples illustrate, your Service Catalog has deep insights on how your requests are being opened and why.
If you’ve invested in driving requests through the Service Catalog, you’re ready to take the next step: unleashing insights on your user need and shifting to a proactive service delivery model!

