Analytics illuminates patterns and behaviors not just by showing information, but by providing context. There are a lot of ways that you can reformat your reports to provide additional context, and in this post we’re going to take a deep look at Year-over-Year reporting.
Year-over-year reporting tries to help you place the current trends in context of trends in previous years. For example, if you’re seeing a spike in incidents, is this a seasonal spike, or specific to this year? Are you on track to have a better or worse year than last year for your KPIs?
Let’s start with a standard trended timeline showing the number of incidents:
The report above allows you to move through the timeline and get as specific as you want.
By clicking YOY: ON in the blue header bar, you can see the timeline overlaid year-over-year, rather than as one long strand of data. (The report’s author can set this as a default for users).
Year over Year in the Pivot
Another example is the same data presented in the pivot:
The above chart allows you to easily compare the values for the same month, year-over-year. However, this view is a little dense… let’s see if we can tease a little more information yet.
Here’s a look at the same using Display As – % running total in column. This helps you see, year over year, how far ahead or behind of the year’s totals each year was.
In this case, because our years are fairly even, you can see that typically we’re hitting ~33% of our incidents by the end of April, and 66% by August. If we see a year that’s significantly different from that, that would help us identify where we’re seeing more or less demand than usual.
Keep in mind that this isn’t the % of total, it’s looking at the % distribution — which is useful for understanding the ebb and flow of incidents over the year (e.g. is it typical to see a spike in the summer, or
Let’s see if we can tease out even more information by using the Display As – % Difference From to compare each of the years:
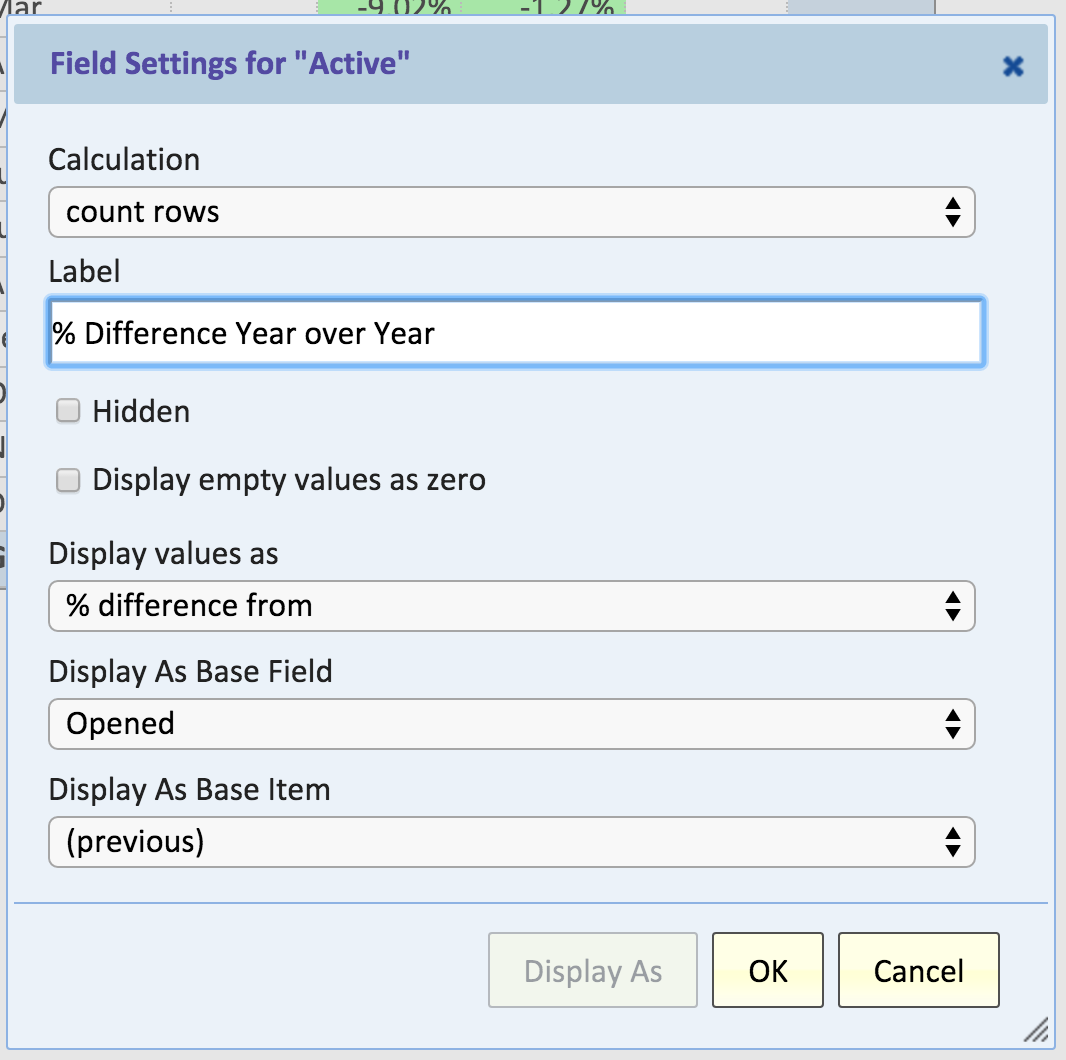
Here’s how it looks:
I also added some light coloring rules to make the information “pop” a little. Because 2013 is the first year we were tracking, we don’t see data there; instead, we see how 2014 compares to 2013, and how 2015 compares to 2014.
There, you can see that overall, 2014 was an improvement over 2013 in most months (except January and September), and overall 2015 was worse than 2014.
You need to combine this context with the other charts to get a full picture, but here we can now see more of the interesting changes.
Note that the pivot above compares each year to the year before it. By tweaking it slightly, we can compare each year to the first year (2013):
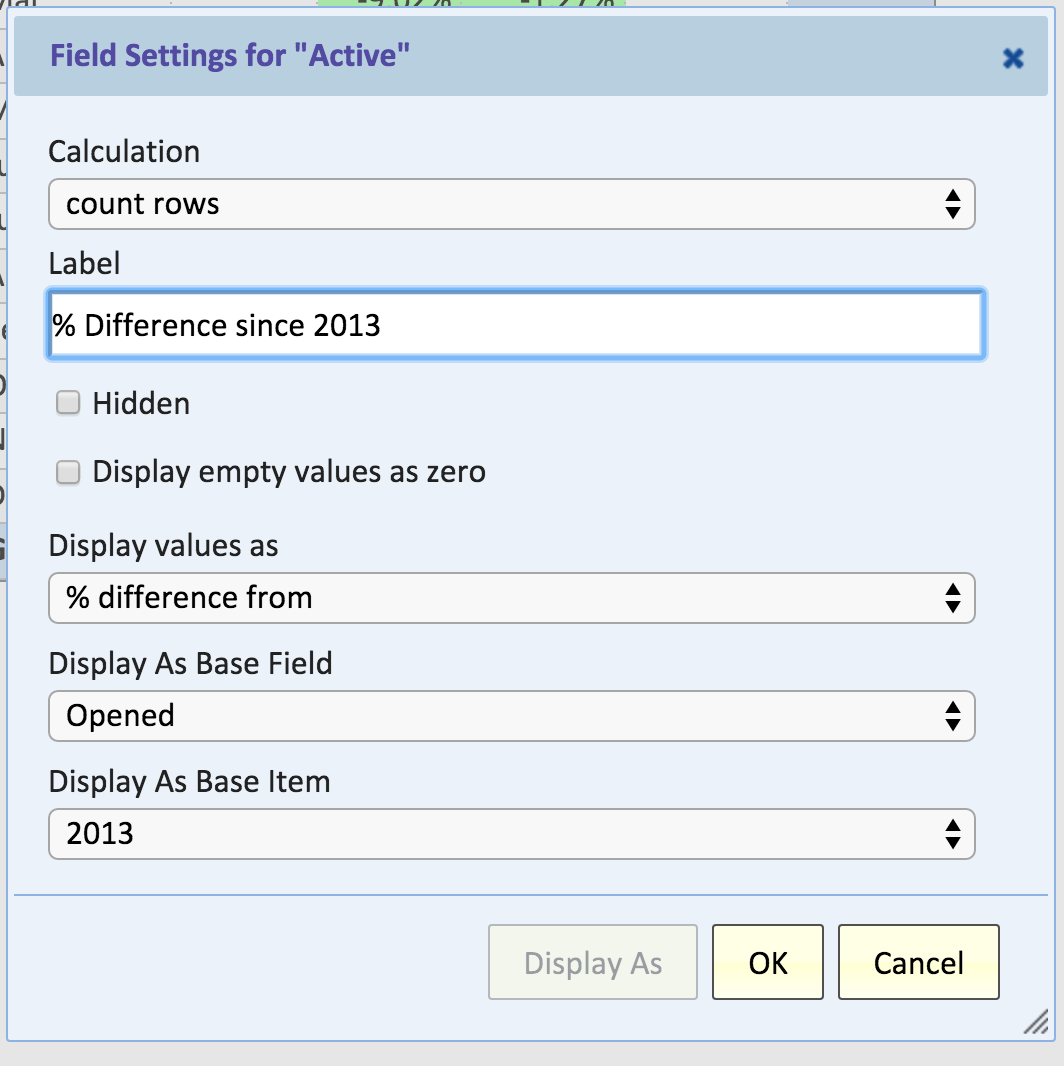
As you can see, with just a few tricks, you can highlight differences and % differences between different years. Explore some of the other Display As options to see what other context you can illuminate through your reports