Explore Analytics empowers user to understand information through advanced analytics using an intuitive, self-service user-interface.
It does this by allowing non-technical users to generate powerful visualizations using drag-and-drop selections and drop-down choices, rather than needing scripts, code, or database work.
For many who’ve worked with business intelligence tools in the past, this may be a conceptual adjustment. As such, I’m frequently asked the question, “Where do I put the SQL?” In fact, Explore Analytics makes it even easier — allowing you to do a lot of what you did before in SQL using an intuitive graphical interface.
To show you what I mean, we’ll walk through an example that shows how we build queries easily, and how you can shift away from writing code to getting information.
Let’s suppose I have a sales database, and I’d like to understand how my customers in the US are paying for my products.
In Explore Analytics, I can analyze this easily using a couple easy drop-down selections:
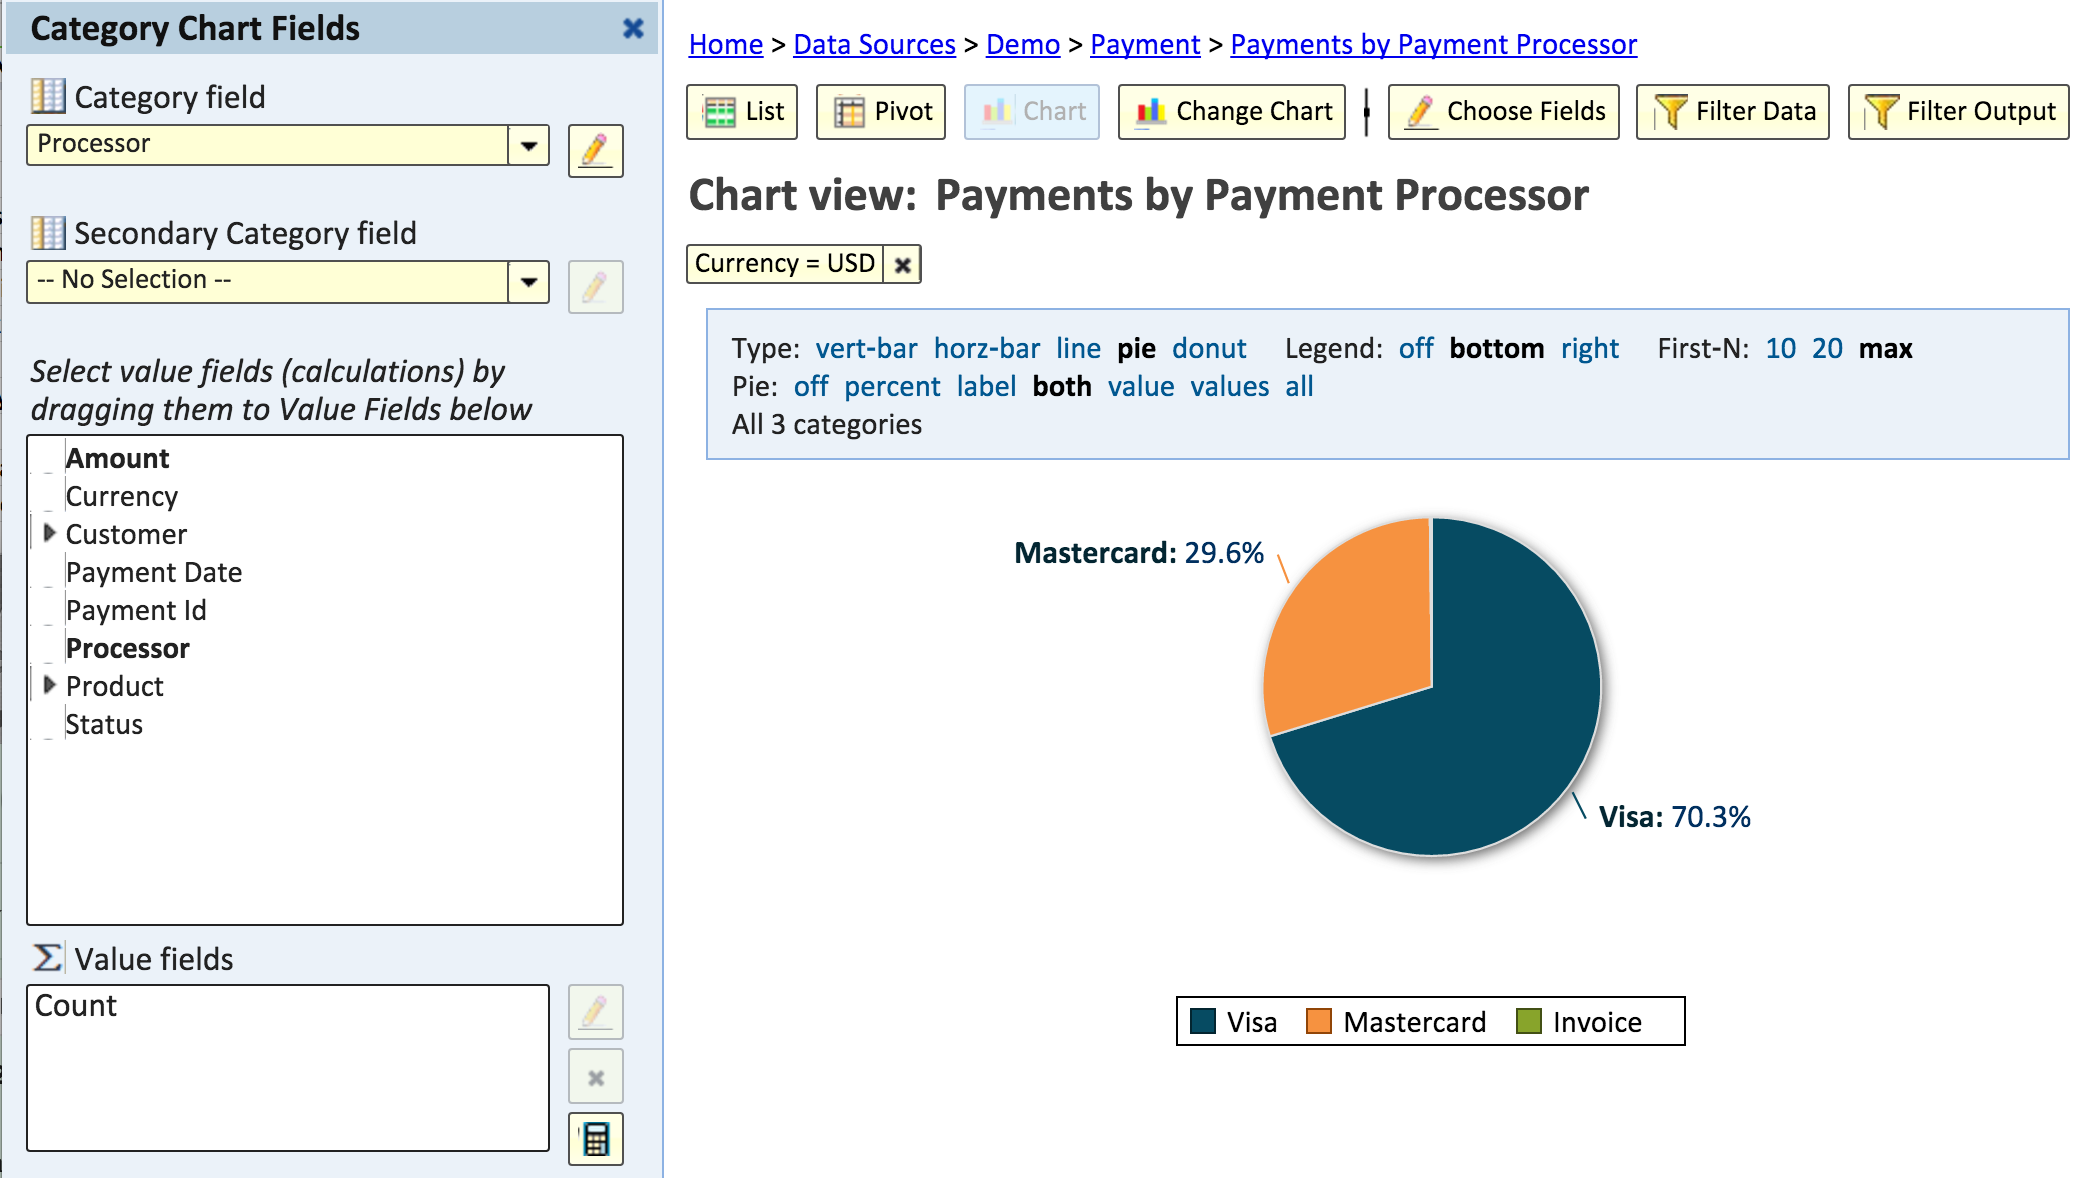
I’ve created a report on my Payment table, categorized by payment Processor, and filtered where Currency = USD.
Behind the scenes, this report will be translated into this query:
SELECT `processor`, COUNT(*)FROM `demo_payment`WHERE `currency` = ?GROUP BY `processor`
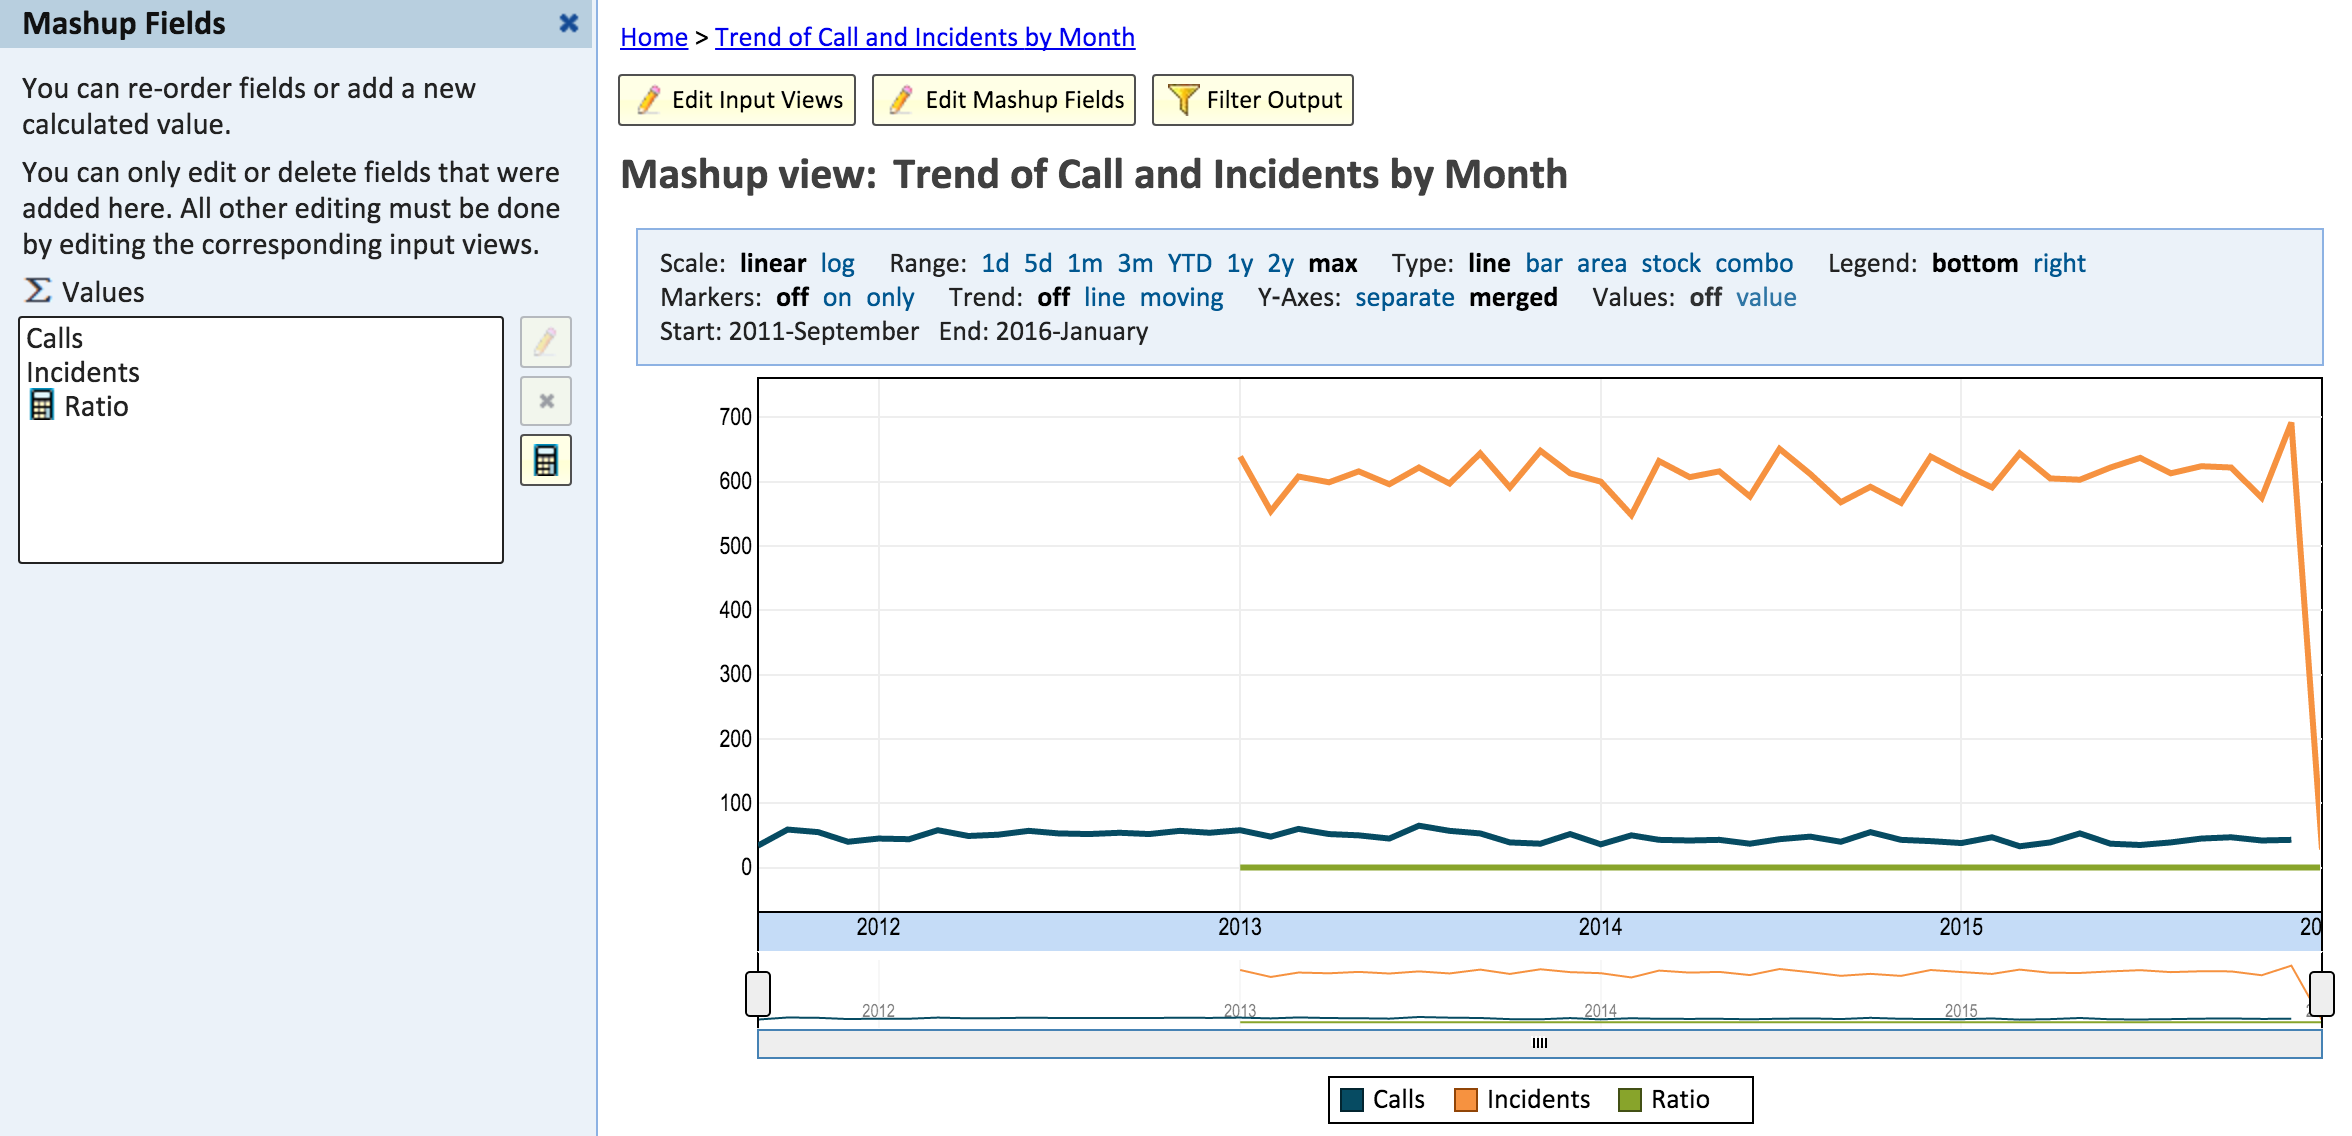
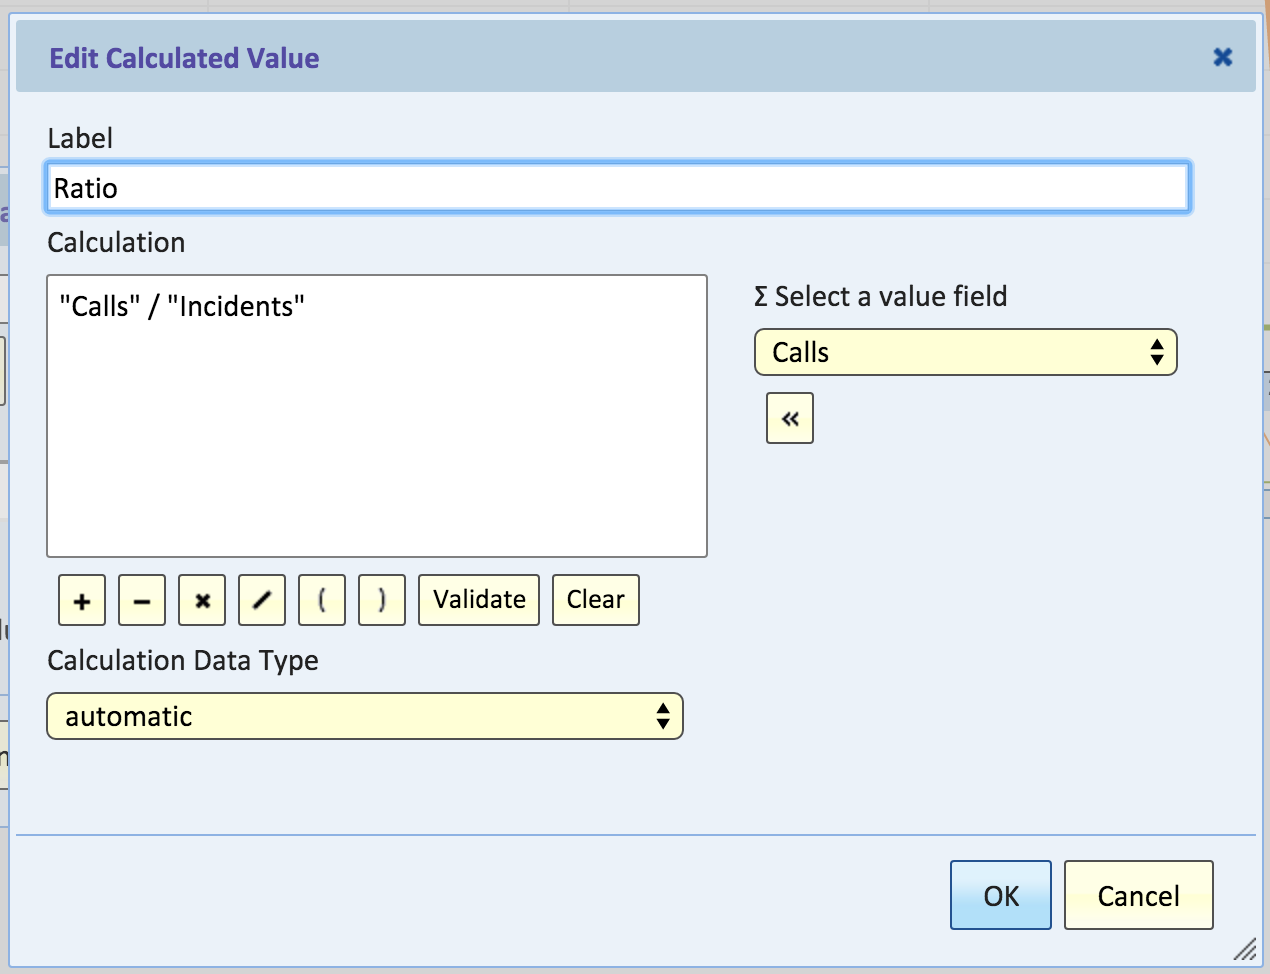
- The Calls query is running against a SQL database.
- The Incidents query is running against an application API (ServiceNow)
- The Ratio calculation is combining against those two data sets in real time.
Without copying data, and without creating a database view, any business user can query multiple data sources and combine the information together.
No SQL statement or statements alone could combine the data as above; you would need to write SQL statements and SOAP API calls, and then write additional code to combine the data together.
Instead, with Explore Analytics’ intuitive user interface, the calculation looks simply like this: