A Tool in Every Service Provider’s Toolbox: Explore Analytics

Service providers are called upon to meet rapidly evolving customer challenges. Delivering quality service requires a toolbox full of flexible, agile tools to meet every new requirement.

For analytics requirements, you need Explore Analytics in your toolbox to ensure you deliver reports and dashboards that empower your customers and uncover the insights they need.

Why? Because Explore Analytics is engineered to be:

  • Flexible enough to tackle every reporting problem
  • Simple enough to ensure you don’t wait for change requests, code changes, or data replication
  • Agile enough to bridge every island of data

The Flexible Tool for Every Reporting Problem

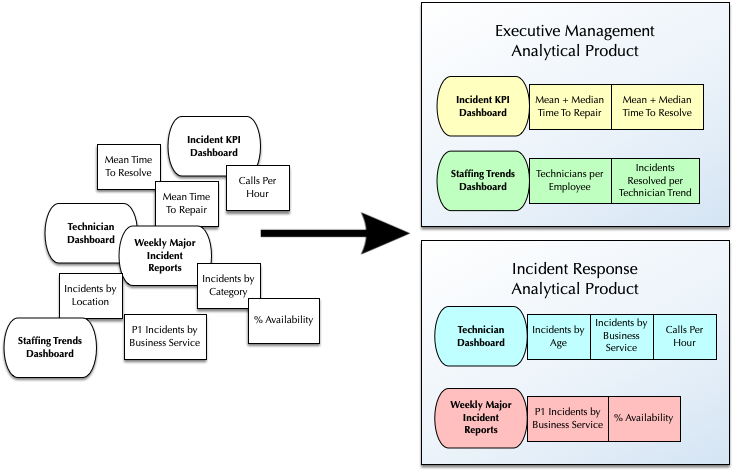
Explore Analytics was designed from day one as a fully-featured business intelligence tool. As such, it is full of advanced features that can easily combine data across tables, apply formulas, and present vivid visualizations. With this comprehensive set of features, Explore Analytics is a get-out-of-jail free card for your most complicated reporting needs.

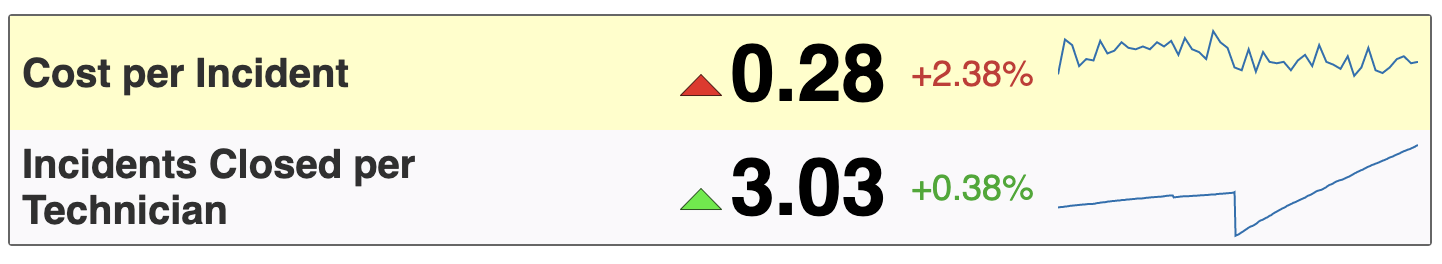
With Explore Analytics at your side, you can embrace your customer’s most ambitious reporting ideas. Instead of being limited to the same basic trends and category charts, you can create advanced real-time analytics that will transform your customer’s processes and delight their executives.

Insight Shouldn’t Wait – For Change Requests, Code, or Data Replication

Customers often ask for insights without knowing if the data is arranged to make such reports easy to build. For those who understand the structure of the data, it can be frustrating to have all the data you need yet be unable to produce the report simply because it is stored in the wrong format or across too many tables.

Many solutions begin with re-architecting the data until it fits the report you’re trying to create. This could include a combination of javascript code to reformat or copy data, administrative changes to tables or fields, or – worst of all – replicating the data out of ServiceNow to a place where you can spend more time and effort rearchitecting the database.

Instead of fitting your data to your reports, Explore Analytics access the data where it is and provides a suite of tools to allow you to meet your reporting needs without changing ServiceNow or removing data to another database. Any reformatting, formulas, or combinations across tables are done easily within the tool, using some configurable drop-downs.

That means you don’t need to wait for QA, code reviews, release cycles, or other cumbersome processes. You also don’t need to take on the risk that these changes will impact the functioning of ServiceNow or other platforms. Any business analyst can easily transform the data into insights without worrying about the impact to anyone else.

Bridge Every Island of Data to Every Audience

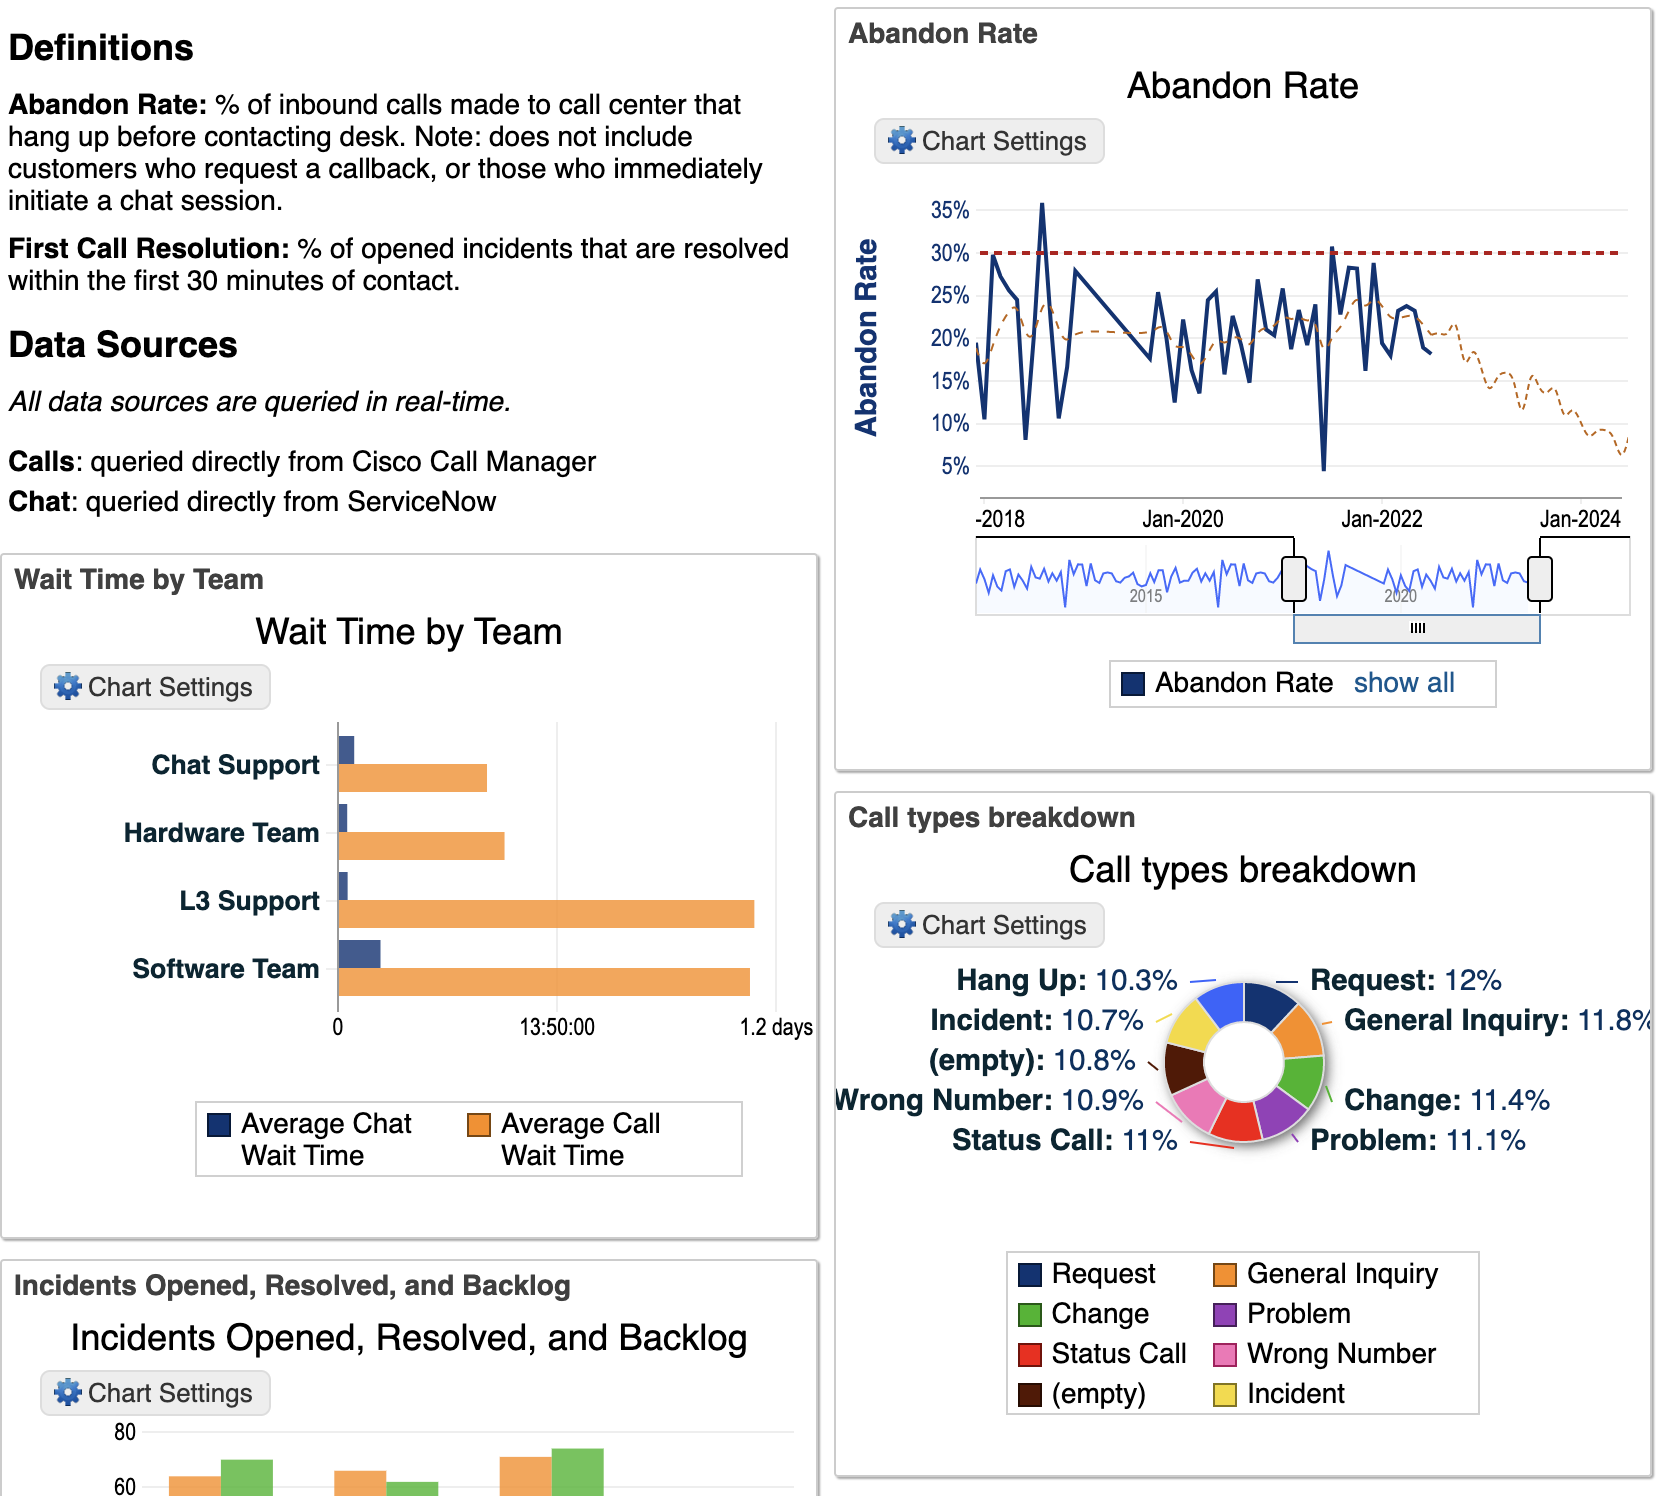
Explore Analytics is architected to connect quickly and easily to multiple sources of data. Without moving any of the data around, you can easily combine data from ServiceNow, call systems, data warehouses, or other adjacent platforms. Instead of silos of data, Explore Analytics allows you to provide insights based on your full context.

Once you’ve built those reports, Explore Analytics also lets you bring that data to audiences regardless of what tools they use. ServiceNow users can access Explore Analytics reports directly on their homepages, drilling through and acting immediately. On the other hand, executives who prefer reports delivered via email can get stand-alone interactive dashboards delivered to them, without requiring logging in to any tools. Meanwhile, your customers can present data in intranet portals, on public websites, in mobile apps – wherever they want their data to be accessed by the best audience.

Explore Analytics: Don’t Leave Home Without It

As a service provider, you want to have the right tools in your toolbox to ensure that you will meet and exceed any challenge your customers ask you to solve. With Explore Analytics, you have the comfort of knowing that you have an all-purpose reporting tool that will rise to meet your customer’s needs, no matter how complex.

By providing a flexible tool, not relying on code or administrative changes, and bridging islands of data together, Explore Analytics will turn your focus away from “how can I solve this?” to “how will I delight my customer next?”

Build Analytics Products, Not Reports

Build Analytics Products, Not Reports

With one simple mindset adjustment, you can transform your reporting approach from reactive and tactical to proactive and strategic. Along the way, you can change how the wider organization sees the value you provide.

How can you accomplish all this? By treating the dashboards, reports, and analytics you provide as a unified product.

Too often, reports and dashboards are considered requirements within some other product or project. Even worse, sometimes reports and dashboards are simply delivered upon request, without being tracked or grouped together.

Instead, create an analytics product: a grouping of all the related reports, dashboards, trend jobs, and reference tables related to fulfilling a set of requirements for a defined audience.

There is clear value in approaching reporting and analytics as a product, including:

  • A more strategic approach to design
  • Higher expectations for your reporting and analytics
  • Clearly communicated value to the organization

A More Strategic Approach to Design

Product management provides structured processes for thinking through the requirements that a product should fulfill to provide value.

Regardless of which product management approach you apply, treating your reports and dashboards a product prompts you to think strategically about what you are building and why.

The first step will be defining what exactly the product is. Simply setting out to create “some incident management reports” is too nebulous for product-focused thinking.

Instead, one analytics product might be Major Incident Triage Analytics, using dashboards to easily drive quick responses based on information drawn from Incident, Change, Outage, and CMDB tables. Another product might be an analysis of incident trends, looking for patterns that would inform support staffing levels or changes to key technology.

Each of these analytics products will likely encompass multiple dashboards, each aimed at a different audience, with underlying trend jobs, reports, and reference tables. Thinking of these dashboards and reports as one product prompts considering how they work together – does the technician’s dashboard prompt actions that improve the KPIs tracked by the executives?

Product-focused thinking will prompt you to ask questions like: what do different audiences need from our analytics product? How do we make this analytics product more functional? How do we expect the users the product to interact with it?

Higher Expectations for Reporting

A natural by-product of this strategic approach to designing dashboards is that you will find that you are asking more of your dashboards and reports.

Reporting and analytics can be simple or extensive; it can provide insights shallow or deep. By focusing on the potential use cases that an analytics product can solve, you will naturally find yourself asking more of the reports.

When reports are simply the last checklist item when deploying some other project, the result is usually simple reports – simple lists, pie or bar charts. For example, an incident management dashboard might go live with a few charts that break up incidents by category, location, and priority.

On the other hand, designing an effective product will prompt you to create more advanced reports to accomplish more. Rather than waiting for a stakeholder to come with a requirement, you’ll already be building high-impact dashboards that go beyond the lowest common denominator.

For example, one large international food service company used Explore Analytics to create an analytical product about their company’s end-customer experience. Because their focus was on a product – comprehensive insight into customer activity – including information from ServiceNow, their call system, and their chat solution was a day one requirement. Why? Because the analytics product only made sense to their users if it included all the information. As a result, they were able to break down silos of information and communicate to stakeholders outside their IT organization in business terms.

The following screenshot shows a similar dashboard example, including information from chat queues, a call system, and ServiceNow incidents to meet the basic requirements of a call center analytical product:

Clearly Communicated Value to the Organization

Once you’ve defined the analytics product, including clear use cases for defined audiences, you are already on your way to communicating the value of your analytics products to the organization.

Defined analytical products give you a concrete and limited set of products to describe, each with a host of use cases and value to deliver. This is much easier to communicate than potentially thousands of reports and trend jobs with no clear relationship.

In the customer experience example above, the analytics product had value that was naturally easy to communicate to executive management. By providing an end-to-end, packaged solution, executives could see the impact on strategic thinking across departments that such mature analytics could bring.

With such comprehensive solutions in hand, asking for the resources you need to reach the next level becomes a straight-forward conversation. Rather than reports being an afterthought that deliver low value and merit little investment, you can place analytics in an important place on your development roadmap.

Create Strategic and High-Value Analytics Through a Product-Driven Approach

As we’ve seen, packaging analytics into products creates a framework for strategic thinking. Thinking about products is the gateway towards an ambitious, proactive approach to reports that deliver high value to the organization. Finally, communicating to executives in terms of analytics products enables clear communication about the value of such analytics and the investments required to deliver more powerful, impactful dashboards in the future.