Difference between revisions of "Publishing"
Gadiyedwab (talk | contribs) |
Gadiyedwab (talk | contribs) |
||
| Line 50: | Line 50: | ||
===Publish to ServiceNow=== | ===Publish to ServiceNow=== | ||
| − | This option is | + | This option is applicable to any view, and is not limited to views with a ServiceNow data source. |
| + | |||
| + | If you have more than one ServiceNow data source, you'll see a drop-down list for selecting the ServiceNow data source (instance) to which the view will be published. | ||
When you publish to ServiceNow, a content block is created in ServiceNow for the published view. A content block can be placed on the user's home page. Each time the home page is refreshed, the view is displayed. The view may be frozen or live and may or may not require the user to log in. | When you publish to ServiceNow, a content block is created in ServiceNow for the published view. A content block can be placed on the user's home page. Each time the home page is refreshed, the view is displayed. The view may be frozen or live and may or may not require the user to log in. | ||
Revision as of 23:19, 5 October 2014
Contents
- 1 Overview
- 2 The Publish Dialog
- 2.1 Title
- 2.2 Subtitle
- 2.3 Frozen
- 2.4 Live
- 2.5 Require the user to log in to see the view
- 2.6 Publish to ServiceNow
- 2.7 Publishing Options
- 2.8 Hide title
- 2.9 Hide header
- 2.10 Hide animation controls
- 2.11 Animation Autoplay
- 2.12 Hide legend
- 2.13 Hide timeline controls
- 2.14 Hide row count
- 2.15 Fit to width
- 2.16 Disallow drill down
- 2.17 Disallow drill through
- 2.18 Hide Explore Button
Overview
Publishing a view makes it available to other people. The view can then be place on a dashboard, embedded in a web page or emailed to people.
In the process of publishing a view, Explore Analytics makes a copy of the view, marks it as "published" and provides various options that we'll explore in more details below. To publish a view, select "Publish" from the "File" menu while viewing the view.
Publishing views requires the publisher role, which is included in the tenant_admin role.
The Publish Dialog
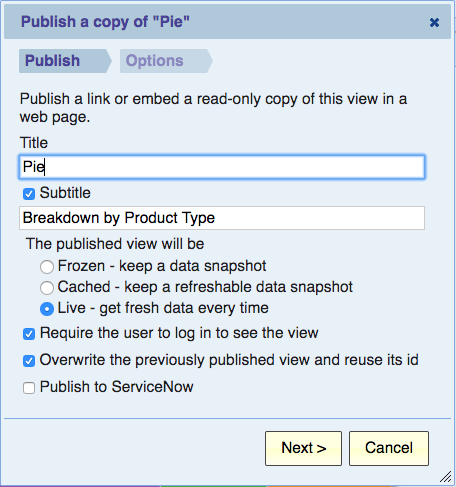
When you select "Publish" from the "File" menu, you'll see a two-step dialog. Let's go over these steps and all the options that each step allows you to define.
Title
This is the name of the published view and it’s also used as its title. By default it’s the same as the view that you are publishing, but you can certainly give it a new title when you publish it.
Subtitle
The subtitle is a second line below the title. For a frozen view (see below), it is often used to display the time that it was published. However, you can use the subtitle for any purpose.
Frozen
A Frozen view is used for showing the data as it was at the time that the view was published. Subsequent changes to the data will have no effect on the view. You can think of the view as "frozen in time".
A Frozen view keeps the data that's needed for rendering the view with the view definition in Explore Analytics. The data is the summary data that's used for displaying the view. It’s stored encrypted on the Explore Analytics server.
A Frozen view does not allow any drill-down or drill through to details. This is because the next level of detail is not captured with the frozen view, and drilling down from frozen data to live data may lead to confusion. For example, a frozen view may show that there were five open issues at the end of the month; drill down to current data might show only three open issues and worse, they may be new issues that have no relation to the five issues that existed when the view was published.
If you want to allow drill-down in a frozen view, you may be able to do that using the Tracking Trend feature. See that page for more information.
Live
A Live view is the normal Explore Analytics view that you’re already familiar with. Each time a Live view is displayed, a query is performed against the data source and fresh data is used for displaying the view. You can think of this type of view as showing "live" data (sometimes referred to as real-time or up-to-the-minute data).
Enabling drill-down and drill-through
Drill-down and drill through to details are possible in a published view, but whether these options are actually available depends on several factors:
- The view must be published live.
- A user must be logged into Explore Analytics (see the next section).
- A user must have the right permissions. See the options "disallow drill down" and "disallow drill through" below.
Require the user to log in to see the view
By not requiring the user to log in, you are able to publish the view to anyone. For example, suppose you wanted to put the view in your blog or web site and allow anyone to see it. People who see this published view do not need to be users of Explore Analytics. You can also email a link to this view to anyone and they are not required to log into Explore Analytics. Requiring the user to log in may be required from a security viewpoint and can be used control access. When you require users to log in, only users who are part of your subscription to Explore Analytics can see this view. Other Explore Analytics users cannot see this view, even if they have a link to it.
Publish to ServiceNow
This option is applicable to any view, and is not limited to views with a ServiceNow data source.
If you have more than one ServiceNow data source, you'll see a drop-down list for selecting the ServiceNow data source (instance) to which the view will be published.
When you publish to ServiceNow, a content block is created in ServiceNow for the published view. A content block can be placed on the user's home page. Each time the home page is refreshed, the view is displayed. The view may be frozen or live and may or may not require the user to log in.
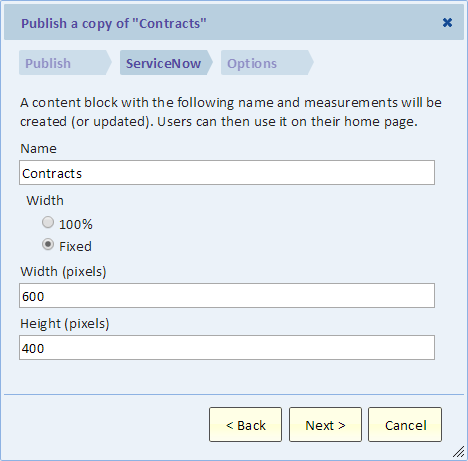
If you select to publish to ServiceNow, an addition step is added to the dialog. This is shown in the following image.
Name
This is the name of the content block in ServiceNow. It does not have to be the same as the name of the view. If a content block by this name already exists (probably from a previous publishing), it is overwritten. This means that when you re-publish a view with the same name, it will automatically be updated in all the home pages that already have this content block.
Width and Height
Here you can specify the width and height of the content block in ServiceNow. ServiceNow content blocks have a fixed width and height and you can set them here or later in ServiceNow by editing the content block. The view will be automatically resized to the content block.
Publishing Options
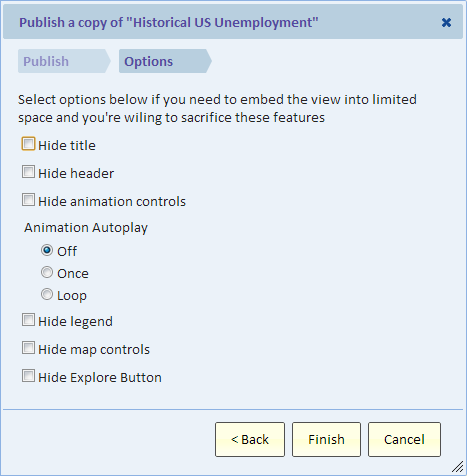
Depending on the type of view, you will see some or more of the options below. These options allow you to control the appearance of the view by hiding certain elements of the view.
Hide title
Hiding the title is useful if you already have caption for the view on the page in which you are showing it, for example a ServiceNow home page.
Hide header
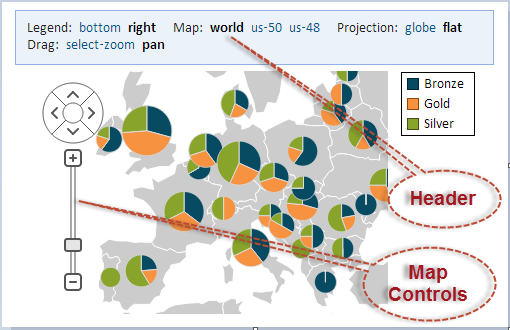
Hiding the chart header makes the chart cleaner and more compact, but deprives the user of some very useful functionality. In general we don't recommend hiding the header unless you're sure that it's not needed. If the chart is animated, a slim header is shown with animation options. To eliminate the header completely in that case, use the Hide animation controls option below. The header is the rectangular area at the top of the chart – see picture:
Hide animation controls
If the chart is animated, you can hide the animation controls altogether.
Animation Autoplay
You can set the animation to automatically play when the user views the chart. This immediately draws the user’s attention to the animation. Moreover, you can have the animation repeat again and again in a loop.
Hide legend
Hiding the chart legend makes the chart cleaner and more compact, but loses important information. Use this option only if you’re certain that the legend is not needed. Hide map controls
For a map chart, you can hide the map controls. This make the chart cleaner (less clutter), but loses a useful control for zooming and panning. There are other ways to zoom and pan, so removing these controls may be useful on a small chart.
Hide timeline controls
For a timeline chart, you can hide the timeline controls that allow the user to zoom and scroll through the timeline. This makes the chart more compact, but loses useful functionality.
Hide row count
For pivot and list views you can save some space by hiding the text that displays the number of rows.
Fit to width
This option applies to pivot and list views and is on by default. Fit to width will resize columns to attempt to fit all the columns in the allotted (horizontal) space. Priority is given to columns that explicitly specify the width (because you previously manually resized them). Other columns would shrink before. There is a minimum width to a column and so there is a limit to how much columns could shrink. If space is too narrow, a scrollbar would show.
There is no "Fit to height". A scrollbar will display if not all rows fit. To limit the number of rows that are shown you can use the "Top-N" button to limit the number of rows to the top n before publishing the view.
Disallow drill down
Use this option to prevent users from drilling down.
Disallow drill through
Use this option to prevent users from drilling through to details.
Hide Explore Button
This option only applies to views being published to ServiceNow. The "Explore" button is shown at the bottom right of the view and allows users to go to the view in Explore Analytics and work with it (for example, authorized users can make a copy of the view and then add fields to the view.)


