Configuring a ServiceNow Data Source
Contents
Overview
Explore Analytics is tightly integrated with ServiceNow to deliver superb data analysis, visualization, and reporting.
- Application-Level Data Access - Explore Analytics connects to your ServiceNow instance using a Web Service (aka SOAP). Connecting through the application ensures that you see the familiar data that you know in ServiceNow and subject to the security access control rules that are defined in the application.
- High Performance - Whenever you access data, Explore Analytics pushes 100% of the data filtering, grouping, and aggregation to the ServiceNow application. By performing these operations at the application, Explore Analytics eliminate the need to pull large numbers of records from your ServiceNow instance.
- Friendly Table and Field Names - Explore Analytics shows the friendly labels that are assigned in ServiceNow so that you see names such as "Shopping Cart" and "Catalog Item" rather than "sc_cart" and "sc_cat_item" respectively.
- Friendly Filter Choices - ServiceNow makes extensive use of choice lists and Explore Analytics fully supports them so that you can construct a filter that looks like "Incident State = Resolved" rather than "state = 6".
- Reference Fields - Explore Analytics understands reference fields and uses them to relate tables and combine multiple tables in a view.
- Duration - Explore Analytics fully supports duration fields (glide_duration). It can perform calculations on time duration such as average elapsed time and use it as a numeric scale in a chart.
- Display Field - Explore Analytics understands the ServiceNow concept of display field and uses it in filters to allow you to naturally construct a filter such as "Caller = Beth Anglin" rather than "caller_id = 46d44a23a9fe19810012d100cca80666".
- Default View - ServiceNow defines a default view for each table. This view organizes fields in a tabular list. When you create a new view in Explore Analytics, it creates a list view that reflects the fields selected in the ServiceNow default view.
- Governance - Explore Analytics limits its load impact to your ServiceNow instance in two ways. Every data access request that it sends to ServiceNow includes a row limit such that it never requests more than a few thousand rows, no matter the size of your ServiceNow tables. Additionally, the number of concurrent requests is limited to a configurable number.
- Security - Explore Analytics connects to your ServiceNow instance using a ServiceNow user that you configure with (only) the necessary roles for data access. Explore Analytics respects access control to tables, fields, and records. Explore Analytics utilizes strictly read-only access and does not allow users to modify data. The data flows to the user's browser without being stored on the Explore Analytics server.
- Direct Links - Clicking on the display name fields (e.g. a computer's name) or reference fields (e.g. the name of the computer's model) will link directly to the appropriate record in ServiceNow.
Configuring the Data Source
Before configuring the data source in Explore Analytics, you'll need to setup Explore Analytics on your instance.
Setting Up Your Instance
You'll need to perform the following steps:
- Install the Update Set
- Define a user
Install the Update Set
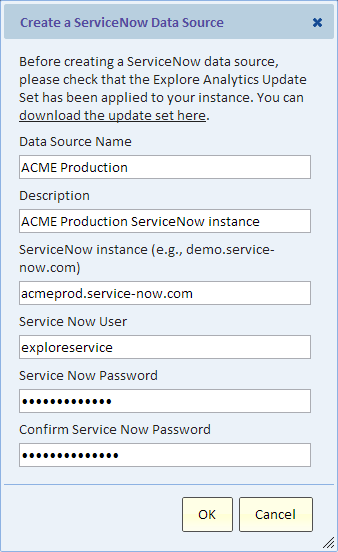
The Explore Analytics app is delivered as an update set that you can import and commit. The update set contains the Explore Web Service. This web service performs data access requests. You can download the update set XML file from the "Create a ServiceNow Data Source" dialog (see image below). You can then import it to your "Retrieved Update Sets" in ServiceNow, preview and then commit it.
The update set also contains objects that facilitate Single Sign-On, allowing authorized ServiceNow users to automatically register and log in to Explore Analytics without having to go through the Explore Analytics registration or log in.
Define a User
Explore Analytics connects to ServiceNow using a specified ServiceNow user. You can setup a user account for Explore Analytics and control data access using ServiceNow roles. You can think of this account as a service account that's only used by Explore Analytics. You can give this account any name and password. For added security we recommend that this user account have a strong password and be used for this integration only.
Define this user account and grant it the "soap_script" role to allow access to the Explore Web Service using this account. Give it the "content_admin" role to allow publishing reports to home pages. Finally, give it any roles needed to access data for reporting (e.g., "itil", "asset", "project_user", "project_portfolio_user")
Setting up the Data Source
In Explore Analytics, select "Add a new Data Source" from the Data menu, and then select "ServiceNow". In the dialog that appears, add a name and description for this data source. Specify the instance domain name, e.g., acme.service-now.com, and the user and password that you defined in the previous step. Click OK and the following things would happen:
- Explore Analytics will configure the data source with all the ServiceNow tables that are accessible to the specified user.
- Explore Analytics will configure the tables with all the fields that are accessible to this user. For each field it will configure its label, type, choice list, display field, and reference table if applicable.
- Explore Analytics will use the information about ServiceNow reference fields to define Explore Analytics reference fields.
- Explore Analytics will define default views for each table based on its default view in ServiceNow.
This can take a few moments to complete. Once it's done you're ready to start exploring your data and building views of the data including lists, pivots, and charts (visualizations).
Refreshing the ServiceNow Data Source
During the ServiceNow configuration process, Explore Analytics will map out the tables, fields, and their relationships. If changes are made to the data model within ServiceNow, the data source should be refreshed, which will rebuild those relationships without disturbing any user-created views.
Additionally, if new updates are added to the ServiceNow/Explore Analytics integration, refreshing the data source will update the data model with those enhancements.
To refresh the configuration:
- Navigate to the New Data > Browse Data Sources and Tables.
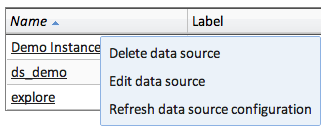
- Click the row for the data source you'd like to refresh.
- Select Refresh data source configuration.
This will take a similar amount of time as the initial set-up of the data source.
Refreshing a Single Table
If you added a field to a ServiceNow table and only wish to refresh that table, then from the list of tables click the row for the table you'd like to refresh and select "Refresh table configuration".
Publishing Explore Analytics Views to ServiceNow Home Pages
Explore Analytics views can be published using the File menu Publish option. If the view uses a ServiceNow data source, then the Publish dialog will have a checkbox labeled "Publish to ServiceNow". If you check this box, then in addition to publishing the view, a content block is created in ServiceNow. You can control the name, width, and height of this content block. Once published, this content block can be added to any home page by selecting "Add Content", under Gadgets selecting "Content Blocks" and then selecting the content block that you created.
Single Sign-On and User Authorization
Enabling
Single Sign-On and User Authorization is only implemented if the option "Automatically register and authorize ServiceNow users" is selected when the Data Source is created or later edited.
Protocol
Single Sign-On and User Authorization uses the Google OAuth 2.0 protocol. When a ServiceNow user tries to access Explore Analytics (e.g., by viewing a home page that contains an Explore Analytics view) and they are not logged in, they are automatically logged on. If the user is new to Explore Analytics, a new user in Explore Analytics is automatically created for the user. The user is then logged on for the duration of the session (typically up to 30 minutes) or until they close their browser.
Running Queries as the ServiceNow User
By default, queries that obtain data for Explore Analytics views run with the identity of the ServiceNow user that's specified in the Data Source configuration. It is possible to run queries under the identity of the logged-in user, this could allow you to implement a view that only shows users data for their ServiceNow group or region. To implement that, you need to follow these instructions:
- In Explore Analytics Data menu, select "Browse Data Sources and Tables"
- Click the row with the ServiceNow data source
- Select "Edit data source"
This brings up the Data Source dialog for the ServiceNow data source. Near the bottom of the dialog, you'll see a checkbox labeled "Run Queries as the ServiceNow User". By checking this box, you enable this feature.
Along with this feature, Explore Analytics allows you to specify calls to ServiceNow functions in filters. This is identical to specifying JavaScript functions in ServiceNow filters and this only works with a ServiceNow data source. For example, the filter can specify "Sys Id" = "javascript:gs.getUserID()". This will invoke the built-in "getUserID" function in ServiceNow. You can also invoke JavaScript functions that you implement in ServiceNow. Please refer to ServiceNow documentation and test it in ServiceNow before using it with Explore Analytics.
The Explore Analytics Application (ServiceNow Application and Modules)
The Update Set includes an Application named "Explore Analytics". The application requires the "explore_analytics" role (also defined by the Update Set).
It includes two modules:
- Reports – takes the user to Explore Analytics and automatically logs them in (if so configured)
- Content Blocks – lists the content blocks that were published by Explore Analytics. These published reports can be placed on Home pages.


