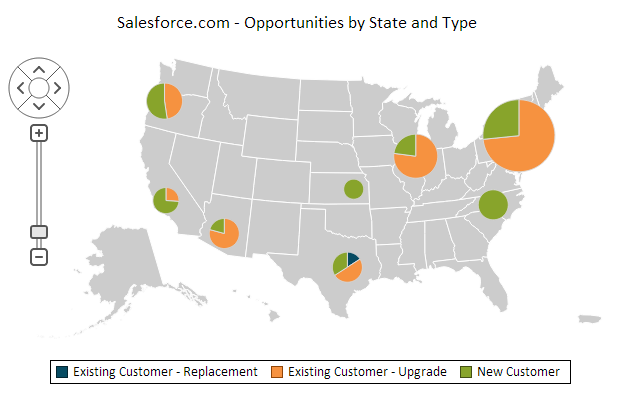
Opportunities by State and Type

Let Your Salesforce.com Data Tell the Story

Combine Multiple Enterprise Data Sources

Explore Analytics opens up your business-critical data to exploration, analysis, and visualization.

Benefits

  • Live reporting against any Salesforce.com and Force.com data
  • Combine data from multiple enterprise sources in one report
  • Complement Salesforce.com with advanced reporting
  • Non-technical users can answer ad-hoc questions

Salesforce.com Reporting Leaves You Wanting More?

Extend Salesforce.com with state-of-the-art analysis, visualization, and reporting. There's no need to compromise. With Explore Analytics, you keep your data in Salesforce.com and provide your users with sophisticated reporting capabilities. You can prepare and publish finished dashboards, or allow users to do their own analysis.
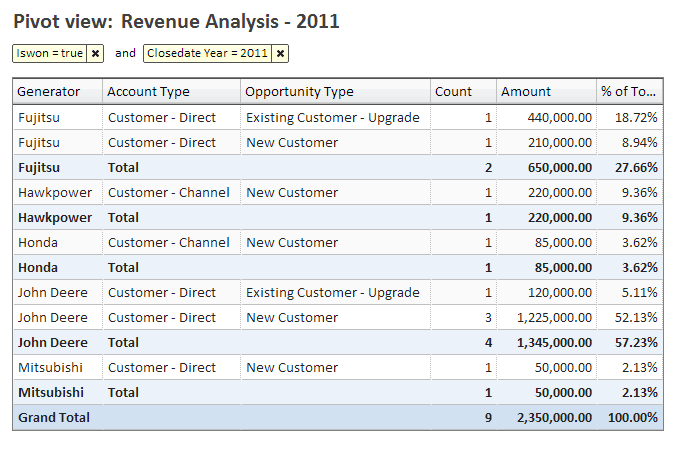
Still Exporting Data to Excel?

Explore Analytics is a robust alternative to Excel for ad-hoc data analysis and reporting. You can access live Salesforce.com data directly or upload your spreadsheets to Explore Analytics. You can combine data from multiple tables in slice-and-dice multi-dimensional pivot-table analysis and create stunning visualizations. You can use animation to add another dimension to your chart. You do all that using your browser or mobile browser.

EXPLORE ANALYTICS

  • No software to install
  • High Performance
  • Live data access
  • Non-technical users
  • Entirely web based - desktop or mobile
  • State of the Art visualization
  • All your analytics in one place
  • Collaborate by sharing and publishing
  • Quick time to value - register, connect, and start visualizing your Salesforce.com data. It's that easy!