Difference between revisions of "The Explore Analytics User Interface"
Gadiyedwab (talk | contribs) |
Gadiyedwab (talk | contribs) |
||
| (19 intermediate revisions by 2 users not shown) | |||
| Line 1: | Line 1: | ||
| − | + | ==Overview== | |
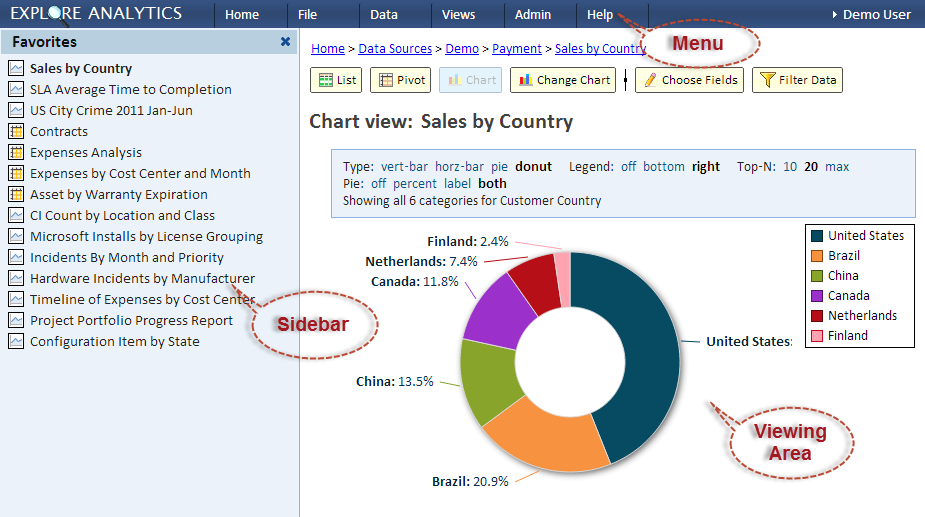
The Explore Analytics User Interface features a main page in which you browse and view data. This page has 3 areas: | The Explore Analytics User Interface features a main page in which you browse and view data. This page has 3 areas: | ||
| − | + | *'''[[#Menu|Menu]]''' - shows the main menu | |
| − | + | *'''[[#Sidebar|Sidebar]]''' - this area is used for showing favorites or showing the view fields dialog. The fields dialog allows you to choose fields for your view | |
| − | + | *'''[[#Viewing Area|Viewing Area]]''' - shows the current view. This area is on the right | |
| − | + | [[File:ui.png]] | |
| − | + | ==Menu== | |
| − | + | The main menu consists of the following sections. Note that the section that the user sees is based on their roles. For example, the Admin menu is only available for admin users: | |
| − | |||
| − | |||
| − | + | * '''Home''' - return to the home page | |
| + | * '''File''' - shows options that operate on the currently showing view | ||
| + | * '''Data''' - shows options for accessing data such as uploading a file or manipulating data sources | ||
| + | * '''Views''' - shows various lists of views: favorites, my views, shared views, and more | ||
| + | * '''Admin''' - shows options for managing Explore Analytics | ||
| + | * '''Help''' - shows links to useful resources and technical support | ||
| − | + | ==Sidebar== | |
| − | + | The Sidebar holds the Favorites list. It can also display the [[#Fields Dialog|Fields Dialog]]. | |
| − | + | ===Favorites=== | |
| − | + | This section lists your favorite views. You can add a view to Favorites using the File Menu. | |
| − | + | ===Fields Dialog=== | |
| − | + | The Fields Dialog provides the options for selecting the fields for your view. | |
| − | + | ==Viewing Area== | |
| − | + | The viewing area displays the view. At the top of the viewing area are the [[#Breadcrumbs|Breadcrumbs]] that provide context and navigation. Below are some buttons that allow you to take actions on the current view if applicable. | |
| − | + | [[File:viewingarea.png]] | |
| − | + | All changes to the current view are automatically saved. | |
| − | + | ==Breadcrumbs== | |
| − | + | The breadcrumbs show the views that lead to current view and allow you to return to any of these views by clicking on the breadcrumb. To refresh the current view you can click on the right-most breadcrumb. | |
| − | + | [[File:breadcrumbs.png]] | |
| − | + | {{Template:TOC|Exploring|Selecting Fields}} | |
| − | |||
| − | |||
Latest revision as of 20:50, 7 December 2013
Overview
The Explore Analytics User Interface features a main page in which you browse and view data. This page has 3 areas:
- Menu - shows the main menu
- Sidebar - this area is used for showing favorites or showing the view fields dialog. The fields dialog allows you to choose fields for your view
- Viewing Area - shows the current view. This area is on the right
Menu
The main menu consists of the following sections. Note that the section that the user sees is based on their roles. For example, the Admin menu is only available for admin users:
- Home - return to the home page
- File - shows options that operate on the currently showing view
- Data - shows options for accessing data such as uploading a file or manipulating data sources
- Views - shows various lists of views: favorites, my views, shared views, and more
- Admin - shows options for managing Explore Analytics
- Help - shows links to useful resources and technical support
Sidebar
The Sidebar holds the Favorites list. It can also display the Fields Dialog.
Favorites
This section lists your favorite views. You can add a view to Favorites using the File Menu.
Fields Dialog
The Fields Dialog provides the options for selecting the fields for your view.
Viewing Area
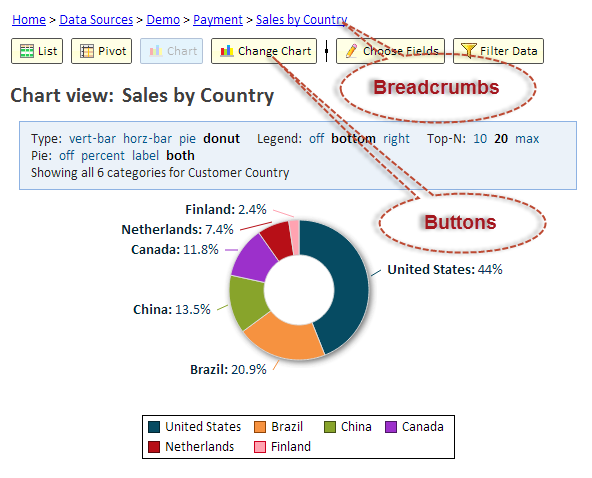
The viewing area displays the view. At the top of the viewing area are the Breadcrumbs that provide context and navigation. Below are some buttons that allow you to take actions on the current view if applicable.
All changes to the current view are automatically saved.
Breadcrumbs
The breadcrumbs show the views that lead to current view and allow you to return to any of these views by clicking on the breadcrumb. To refresh the current view you can click on the right-most breadcrumb.

