Custom Map
Introduction
The Map Chart provides two mechanisms for using custom maps:
- Custom Map – a map projection that provides the background of a map chart. This is similar to the built-in us-48 map that focuses on the continental United States.
- Custom Location Map – a map of a set of geographical areas (boundaries). For example, provinces or council districts.
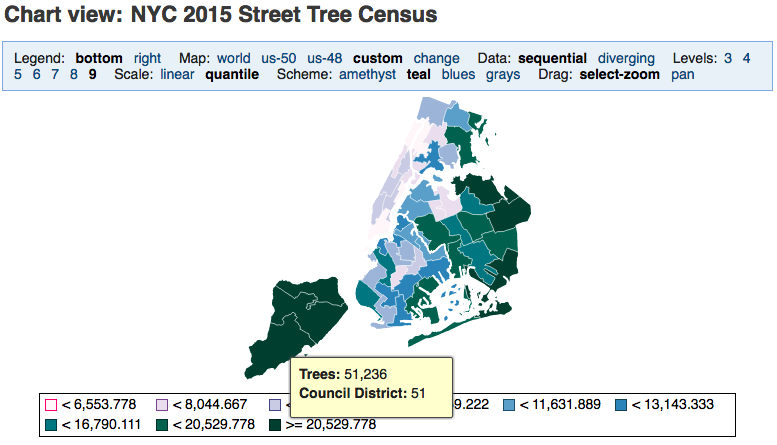
The two types of custom maps are often combined, where the former is used to focus the chart on a geographical area and the latter provides a division of that area into smaller areas that will be colored. For example, a Custom Map of New York City boroughs, and a Custom Location Map of NY City Council Districts.
Map Files
Custom maps are uploaded to Explore Analytics as a file in GeoJSON format. Coordinates in the file must be specified in degrees (World Geodetic System). The map chart ignores elevation and only uses the latitude and longitude part of the coordinates.
Where to Find a Map File
Many maps are available online for free or for purchase. They are often in a format called a Shapefile. You can convert a shapefile to a GeoJSON file using tools. For example, a tool found at https://mapshaper.org. This tool can also simplify the file by smoothing the shapes. This has the benefit of greatly reducing the size of the file and the time it takes to draw.
Size Limit
As explain the the section "Where to Find a Map File" above, It is important to limit the detail on the map features and limit the size of the map file. A chart would actually look better with smoother shapes (fewer details) and the file will download to the browser faster. For those reasons, the maximum file size is currently set at 8MB. We recommend trying to keep it even smaller if possible.
Custom Map
A Custom Map:
- Defines a map projection – mapping coordinates onto the screen. This centers and focuses the view on the area defined by the custom map (rather than the entire globe).
- Is drawn as the background of the map. This can be a single area (e.g., a country) or a set of adjacent areas (e.g., Canada Provinces – together forming a high-level map of Canada).
You can use a custom map for a map showing points or for a map of geographical areas (Choropleth).
Custom maps are shared objects that can be used by any map chart by any user. Be careful then when updating or deleting a custom map as it will affect all the map charts that use it regardless of the user who created the map. It will affect a map that’s using it even if it’s already published.
Selecting and Uploading a Custom Map
Users can select “Map” in the chart header and switch between “world” and “custom”, for example. If the user is permitted to edit, the “change” option allows the user to select a custom map and even edit, add, or remove custom maps.
Selecting a Custom Map
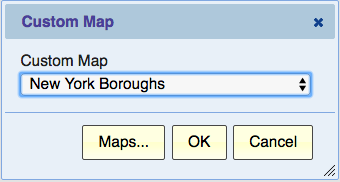
When you click “change” on the Map selection in the chart header, the following dialog appears.
Using this dialog, you can select previously uploaded maps. You can select --No Custom Map-- to have no custom map for this chart. To add, edit, or remove custom maps, click the “Maps…” button.
Managing Custom Maps
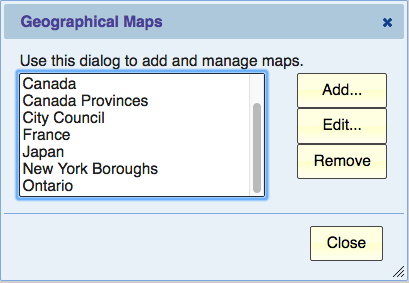
When you click the Maps… button in the previous dialog, the Geographical Maps Dialog is displayed.
The list shows the currently available maps. If the list is empty, your only available option is “Add…”
Uploading a Custom Map
To create a new map or to upload an updated file for an existing map, click “Add…”. The first step is to select a GeoJSON file. Once the file is uploaded, you’re prompted to give the map a name. If the file that you’re uploading is intended to update an existing map, enter the name of the existing map. After this, the map is automatically selected.
Editing a Custom Map
Use this option to change the name of the map.
Removing a Custom Map
If the map has been used for some charts, it’s better not to remove it. Removing it would affect all the charts that use it, including published charts and charts belonging to other users. In that case, it’s better to add a new map (give it a new name) and use it for charts going forward, without affecting existing charts that use the old version of the map.
Custom Location Map
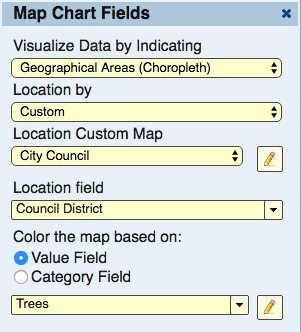
A “Location Map” is a map used in a Choropleth (Map by geographical areas). It is used in the fields dialog when selecting the location field for the custom areas of the map.
When creating a Choropleth, select “Location by” of “custom”. The Location Custom Map selection allows you to select from a list of the existing location custom maps. To add, edit, or remove location custom maps, click the button with the pencil icon that’s right next to the Location Custom Map selection.
Managing Location Custom Maps
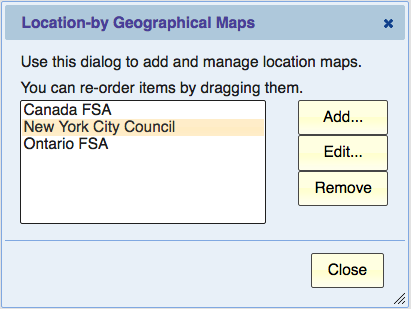
The setup button next to the Location Custom Map displays the “Location-by Geographical Maps” dialog. This dialog allows you to add, edit, or remove location custom maps.
The list shows the currently available maps. If the list is empty, your only available option is “Add…”
Uploading a Location Custom Map
To create a new location map or to upload an updated file for an existing location map, click “Add…”. The first step is to select a GeoJSON file. Once the file is uploaded, you’re prompted to edit a few options (see Editing a Custom Location Map immediately below). If the file that you’re uploading is intended to update an existing map, enter the name of the existing map.
Editing a Custom Location Map
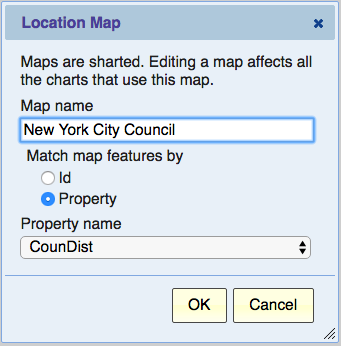
Use this option to change the name of the map and select how areas are identified.
If there’s more than one way of identifying map features (geographical areas such as council districts), then you’ll see a selection “Match map features by”
- Id – the GeoJSON file has an “id” property for each feature. We can use this “id” to match against the location field in your data.
- Property – the GeoJSON file has “properties” for each features. We can match the location field in your data against one of those properties or against all of them (any that would match). The “Property name” selection allows you to choose “ANY” or a specific property (sometimes there’s only one).
Removing a Custom Location Map
If the location map has been used for some charts, it’s better not to remove it. Removing it would affect all the charts that use it, including published charts and charts belonging to other users. In that case, it’s better to add a new location map (give it a new name) and use it for charts going forward, without affecting existing charts that use the old version of the location map.
