Coloring Rules
Contents
Introduction
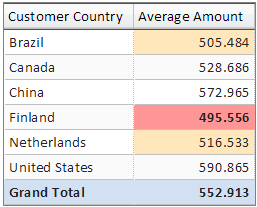
Coloring rules allow you to change the color, background, and make text bold based on the value. You can use coloring rules for Pivot values fields, List fields (numeric and duration), and Scorecard View main indicators. For example, in the following view we highlight values that are below 500 in red and values below 520 in pale orange. In this example, values that meet our target (520 or higher) are not highlighted.
Creating or Editing a Coloring Rule
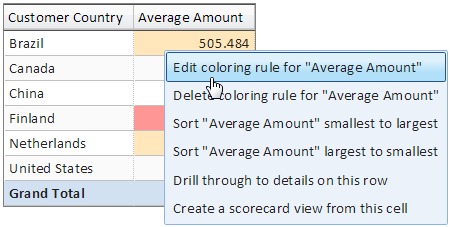
You define a coloring rule for a field. For example, in a pivot view, If your pivot has more than one value field such as Count and Amount, you can define a coloring rule separately for each field. To create or edit a coloring rule, click on any value cell (list or pivot) and select "Create coloring rule", or "Edit coloring rule" for editing an existing coloring rule. In a scorecard main indicator. Select the coloring rule option for coloring when editing the scorecard main indicator item.
The Coloring Rule Dialog
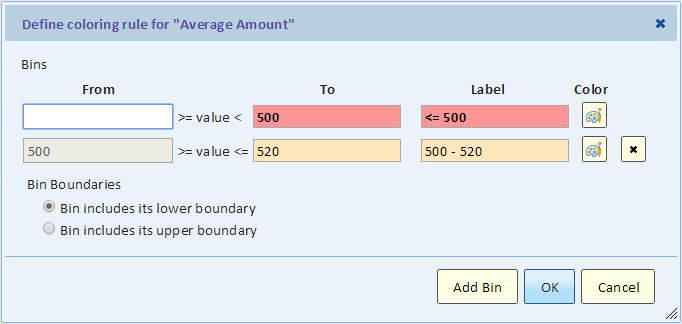
A coloring rule is defined using bins (ranges or values). In our example, we define two bins, one for values lower than 500 and one for values between 500 and 520.
For each bin, click the "Color" button to define one of three options:
- Background color - the cell will have this background color for values that fall in this bin
- Text color - the text will be displayed in this color for values that fall in this bin
- Bold font (or Normal font) - the text will be bold (or normal) for values that fall in this bin
You can select colors from a predefined palette, select a custom color using the color picker, or enter a color hex value directly into the color picker.
Use the "Add Bin" button to add additional bins.
Use "Bin Boundary" to determine whether bins include their lower/upper bounds. The first bin always includes its lower boundary and the last bin always includes its upper boundary.
Coloring Rules and Mashup Views
A mashup view inherits coloring rules from its input views. A pivot mashup can also have coloring rules for mashup calculations.
If multiple input views have coloring rules for the same value field, the first input to have a coloring rule wins.
You can create and edit coloring rules for a mashup just like you do for any pivot or list view by clicking on a cell and selecting "Create coloring role" or "Edit coloring rule". The rule will be attached to the first input view that has this field.
Coloring Rules in a List View
You can define a coloring rule for any field that is numeric in nature. This include a duration field, decimal or integer. If the field is calculated and is numeric, but is displayed as text, you may need to edit the calculation and explicitly define the type to decimal, integer, or duration.


