Every nice piece of work needs the right person in the right place at the right time.
– Benoit Mandlebrot
Explore Analytics gives you more possibilities than ever before to get the data you want at your fingertips.
Understanding how Explore Analytics’ self-service analytics can give you live, frozen, and trended views of your data can help ensure that your organization has the right information at the right time.
Live Reporting
Explore Analytics’ innovative live querying capabilities give you the ability to have the information you need, up to the minute.
This is key for actionable analytics; views on your information that you can drill into and take action on immediately.
In this example, we’re able to see the current changes assigned to various teams, grouped by how much time is left before those changes are due:
Authenticated users can drill in to the tasks behind the pivot and immediately take action, focusing their attention on the most urgent upcoming changes.
This is a key distinction between Explore Analytics and data warehouse solutions — Explore Analytics can connect to your data live.
When it comes to data warehousing, data is copied on a scheduled basis, meaning that your reports are only as fresh as last night’s or last week’s scheduled job. As your team works over the day, the report quickly becomes out-of-date, making these reports stale and difficult to take reliable action on.
Explore Analytics connects live to ServiceNow, SQL databases, and other data sources using standard drivers, meaning when you load the report, you get the data at the moment you’re looking at it: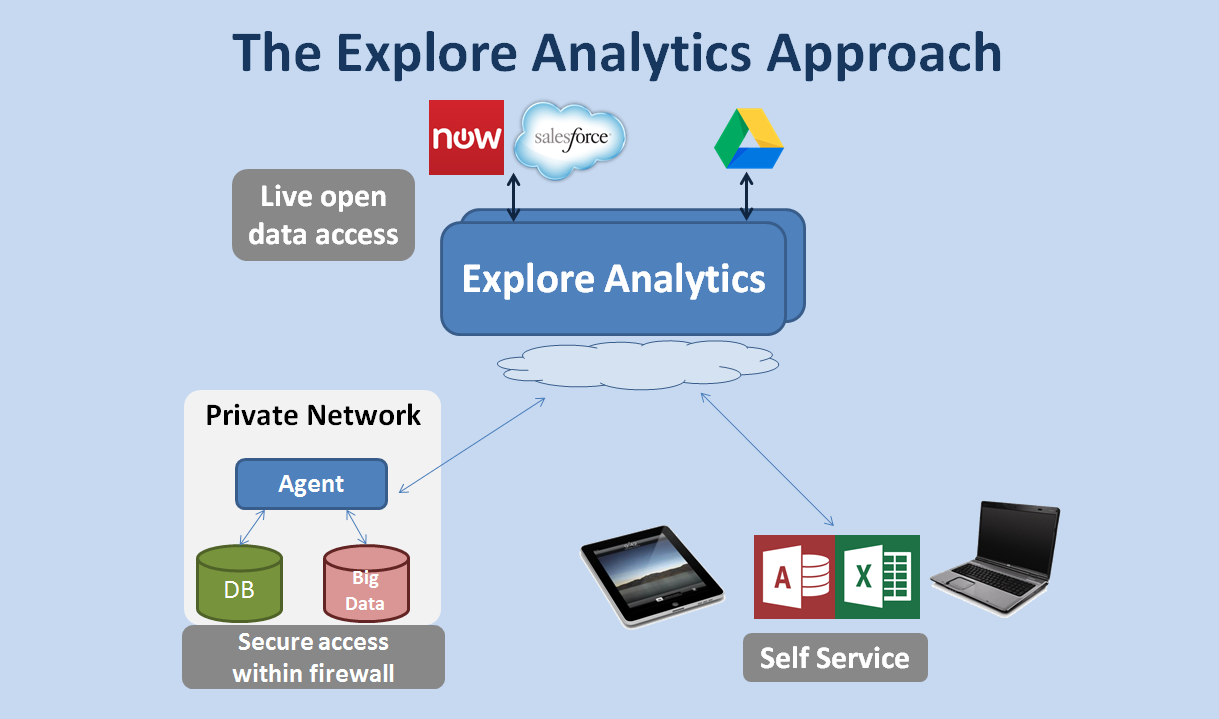
Live reports are great for:
- Live dashboards for teams to work from to perform day-to-day work
- Up-to-the-minute updates to executives and management
- Real-time exposure to customers and clients of current performance of services
Frozen Reports
Once you get your hands on live reporting, it may seem like every report should be a live report. Live reports are compelling and bring you up to the moment.
However, Explore Analytics also offers frozen reports, which cache the results of the report at the time that it is prepared.
This allows the report’s author to ensure that the viewer sees the same report with the same data as the author.
This also allows the report to serve as an archive of a point in time.
Frozen reports are great for:
- Scheduled status updates (e.g. week-end reports, quarter-end reports)
- Reports for presentations, articles, blog posts (like the embedded reports in this report)
- Reports for auditors or compliance
Trended reports
The last approach to reporting is historical, trended reporting. In many cases, writing a live report generates a report that has more information than is captured in the data itself. The data is calculated or counted live, and therefore can’t be calculated or counted in the past.
Some examples:
- The number of currently open incidents in the back log (which is counted live)
- The average cost per incident (which is calculated live)
- The current average time for completing SLAs (which is calculated live)
You’ll notice that what these examples have in common is that they are Key Performance Indicators (KPIs) — metrics which are captured at a point in time, but which we want to compare to past and future performance.
Users working day-to-day may work from live reports, but strategic decision-making and long term planning often relies on this historical information.
That’s why Explore Analytics allows you to take any live report and trend it on a regular basis (daily, weekly, monthly, etc.), simply by clicking a menu item.
For example, this report tracks the average time it takes to complete resolution SLAs by group, trended weekly:
Blending Them Together
Each of the reporting methods above have advantages and drawbacks, and are useful in different situations. With Explore Analytics, you get all of these approaches — and, you can blend them together in interesting ways to get a fuller picture.
For example, this scorecard shows a live view of a metric (the current average cost per incident), and authenticated users can drill down to a historical trend of the same indicator:
This mash-up view combines two live views (trend of opened, trend of resolved) with a trended view (backlog) to allow you to compare those indicators over time:
Conclusion
Explore Analytics gives you a breadth of choice in one consistent interface for three types of reporting:
- Live reporting for actionable, up-to-the-minute dashboards
- Frozen reporting for regular status reporting
- Trended reporting for KPIs and historical analysis
If you’re interested and you want to give it a spin, take advantage of our free thirty-day trial and see which kinds of reporting are right for your reports!